InOrbit is a distributed, cloud-based RobOps (robot operations) platform that enables teams deploying robots to get to market faster with a robust product, and takes the stress out of scaling, at any stage. It's easy to get started receiving real-time data from your robots. Almost everything is customizable and extensible.
InOrbit offers several editions based on your needs. Click here for more Information.
![]()
Free functional version of InOrbit with sufficient features to support basic RobOps

Paid InOrbit version with a broader set of complete features, along with some limited versions of more advanced features

Special paid version of InOrbit with all features included, designed for companies that are looking to maximize RobOps capabilities
![]()
Leverage the full scope of the platform for a small number of robots. Learn more.
Read on to learn how to get the most out of InOrbit. Need some extra help? Contact us at support@inorbit.ai
InOrbit Control is a tool for managing robots and viewing robot data. InOrbit Control is based on dashboards that make it easy to personalize the user experience with rich visualization and interactive robot controls.
You have full control over creating dashboards and setting visibility and permissions in order to personalize the experience to different user roles.
Control and Dashboard Overview
Your InOrbit Control account can have multiple dashboards, which provide targeted experiences for every role on your team.
The following dashboards are the default set for your account, which can be modified:
- Locations
- Fleet
- Robot
- Navigation
These are just a starting point. As an Owner or Administrator, you can customize any dashboard.
With these roles, you can also create your own dashboards* from scratch.
The following default roles have been created for your account.
- Owner
- Administrator*
- Manager
- Engineer*
- Operator*
- Viewer*
*Available in Standard and Enterprise Editions
Who sees which dashboards?
Depending on a user’s role, they will have access to different dashboards. For example, someone with the Operator role will see:

Locations dashboard
The locations dashboard allows you to configure powerful operational rules for your sites. Each location is made up of areas which represent different parts of your facility like different floors.

Selecting a location will take you to the locations editor widget. Here you can add new areas to your location. For each area, you can add maps from an image or directly from one of your robots. You can select a default area for the location, and a default map for each area.

Once you have a default map, you can annotate the map waypoints and zones.
To view multiple robots on a shared map, you can use the Map Aligner tool to visually align a robot map to the default map.
Fleet dashboard
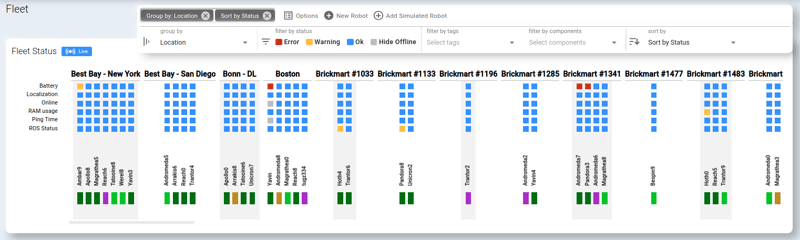
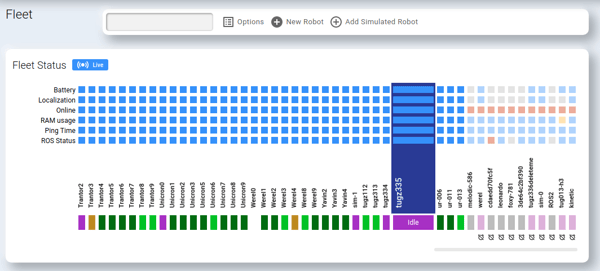
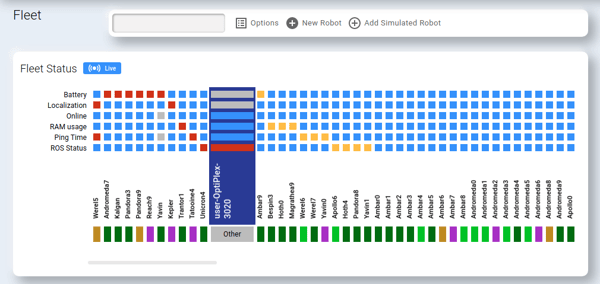
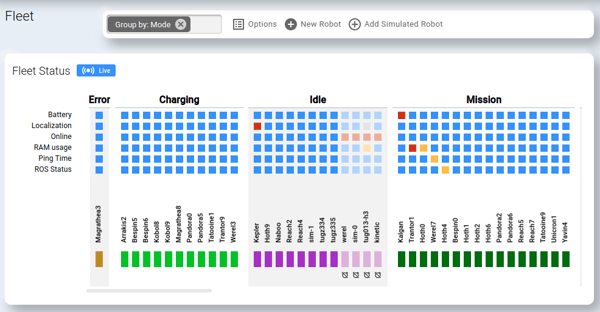
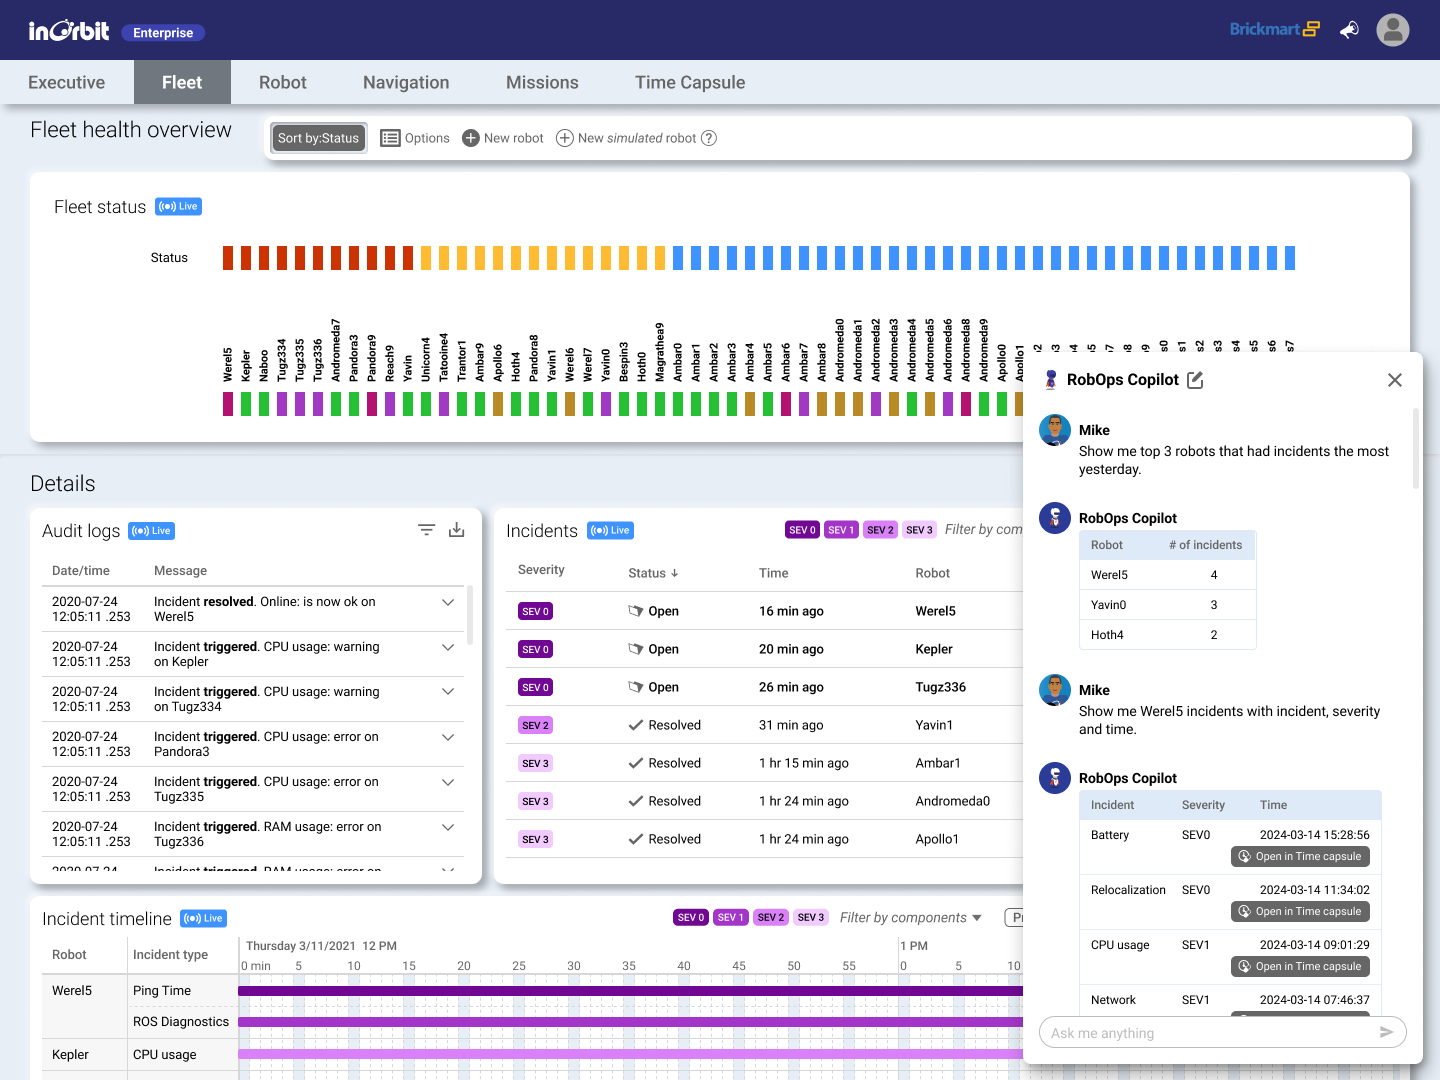
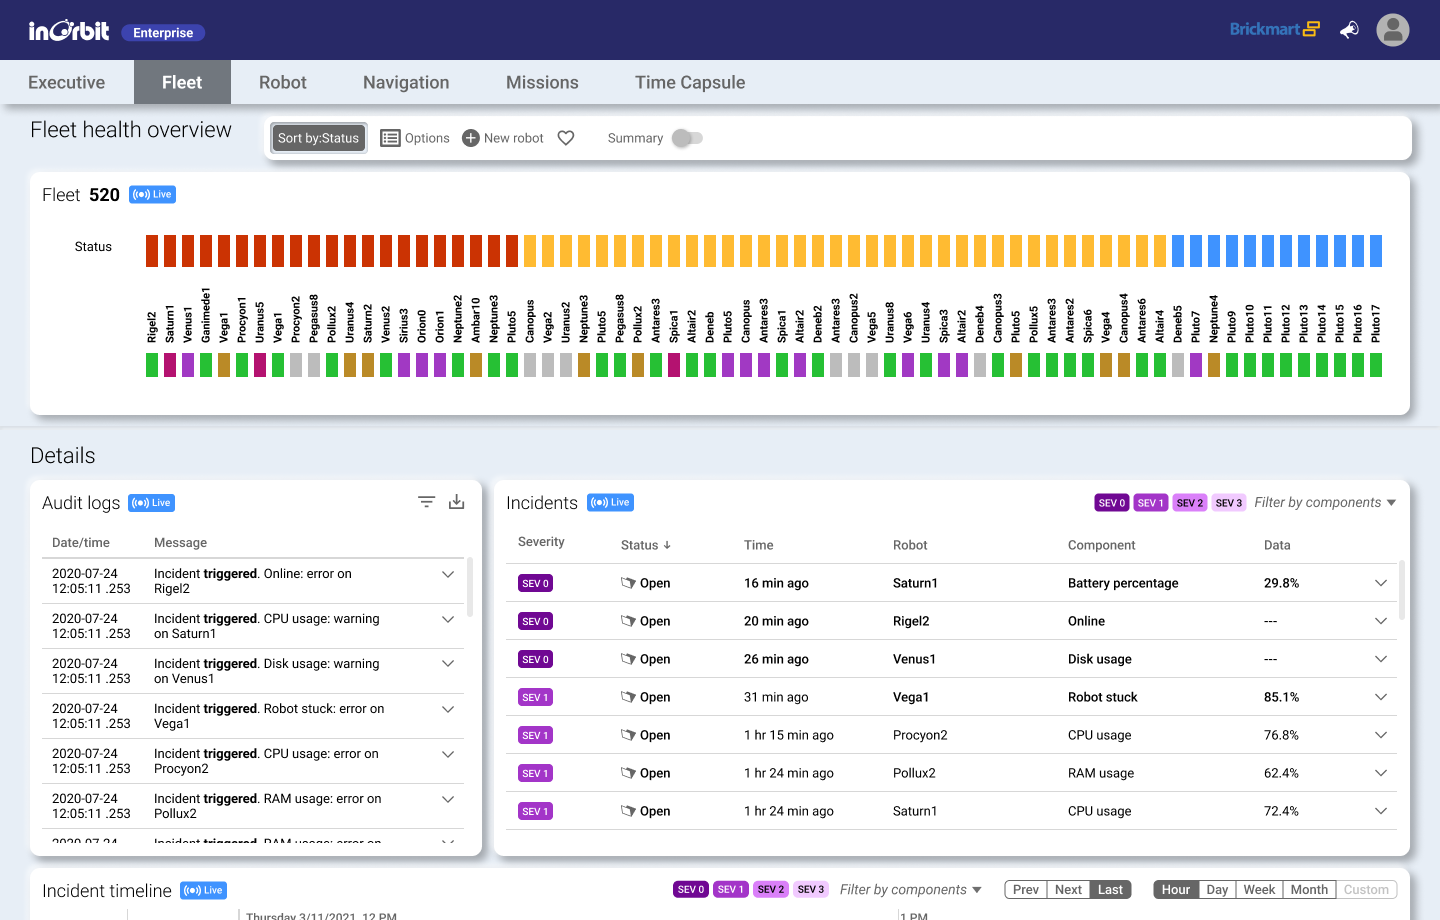
The Fleet dashboard is one of InOrbit’s default dashboards. It shows an overview of your real-time fleet health.
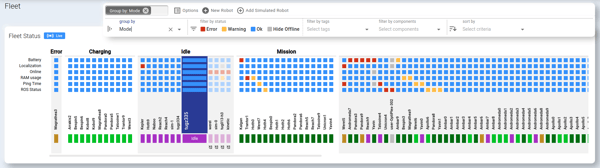
The Robot Fleet View widget is a table that displays a general overview of your robots, based on certain characteristics, described below. In the default sort (by status), robots with errors and warnings (see Incident management - incident definitions) are always on the far left to give immediate visibility to robots that may need attention. You can change the view of your fleet to group, filter, and sort by certain criteria so you can focus on specific Collections of robots (see Collections, Locations, Modes).
|
Section |
Description |
|
Fleet |
If robot collections have been defined, use the collections pulldown menu to select the collection you want to see. (A collection of robots is a group that you define for easier management. By default there are no collections, so Fleet View shows all robots.) You can group the fleet view by the following fields: Ungrouped (default), Location, Hardware, Customer, and Mode. Without customizing the fields, the groupings have no effect. Mode has some defaults: idle, charging, on mission, and more. |
|
Status |
On the left of the table are the characteristics of the robots for each row of the table. The default characteristics are Battery, Disk Usage, RAM usage, Diagnostics, Localization, ROS Status, and payload weight. |
|
Robot list |
The columns of the table list the color-coded status of the characteristics of individual robots. Red is error, yellow is warning, and blue is OK. |
|
Robot names |
Names of robots are below the table. Use the scroll bar at the bottom to see the status of other robots in the fleet. Beneath each robot name, the mode of the robot is displayed. |
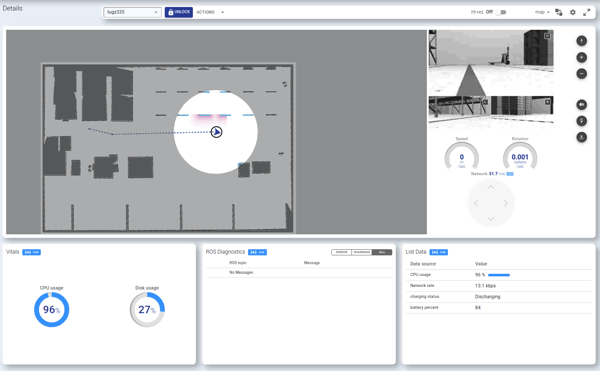
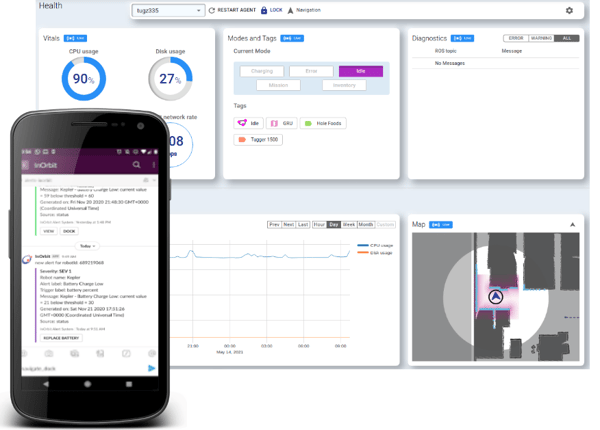
Robot dashboard
The Robot dashboard is a view of the most specific details about a selected robot using visualization widgets, such as Vitals, Modes and Tags, Map, etc. You can also perform certain actions on a robot (see Configure actions for more information).
In the ROBOT / field, enter the name of the robot whose details you want to see. Across that row are actions that can be taken or shortcuts to other elements of the Control user interface, e.g., RESTART AGENT, UPDATE AGENT, NAVIGATION, UPDATE AGENT, SETTINGS).
Some of the default widgets in individual robot details include the following:
- Vitals
- Modes and Tags
- Timelines (Operating Metrics, Network)
- Actions
- Robot Log
The list and order of the widgets can be customized to your liking.
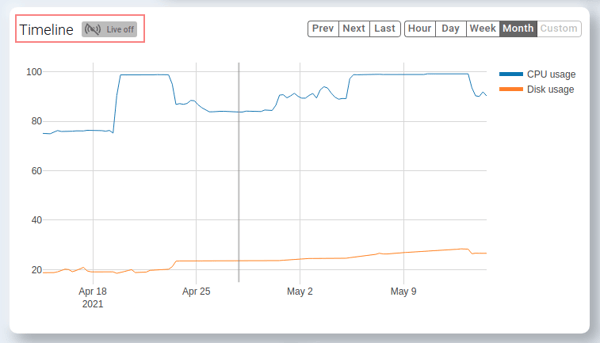
Show “Live” data in your widgets
InOrbit Control shows all the robot information in real-time by default, indicated by blue "Live" indicators. But some widgets allow you to select a time range in the past. When you do, it switches the data from real-time to "Live off", indicated by a gray indicator. In this case, clicking on the "Live off" indicator takes you back to a default "Live" mode where all the data is real-time, and removes the time range filter you applied.
This is the timeline widget with the “Live” switch on:
This is the timeline widget with the “Live” switch off:
This option is included in the following widgets:
- Timeline
- Incident Timeline
- KPI indicators
- Audit Log
- Key/Value sources
- Map
- Vitals
- Modes and tags
- ROS Diagnostics
- Locations
- Fleet status
- Robot actions
Despite this button appearing in all the widgets mentioned above, it only can be toggled in the Timeline, Incident Timeline and Audit Log widgets.
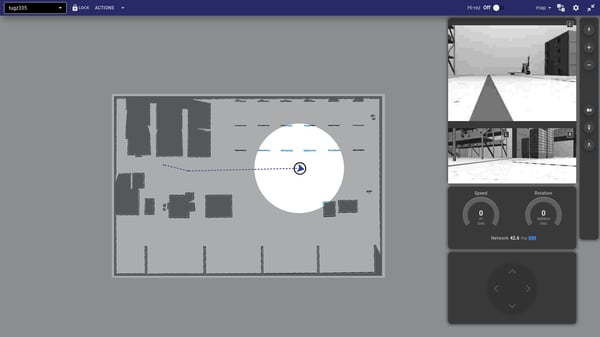
Navigation dashboard
The Navigation dashboard lets you monitor a robot via Map and Camera views, as well as other key data that is relevant during navigation. It’s easy to switch between robots by using the robot selector in the upper left. At the right side of the bar, you’ll find the Hi-rez toggle button (optional feature you can request to add) to temporarily improve the quality of the primary camera , the map selector, the map/camera button to switch between featuring the map or the primary camera, the full-screen button for a deeper experience, and the settings button to configure your navigation preferences.
In addition to executing one-click actions, you can relocalize the robot if it gets lost, or use teleoperation to assist the robot with navigation.
Expand to full-screen navigation
Clicking on the ![]() button expands the robot navigation widgets (Map, Camera, Teleop) to maximize the view, giving you extra details to precisely help the robot navigate.
button expands the robot navigation widgets (Map, Camera, Teleop) to maximize the view, giving you extra details to precisely help the robot navigate.
Exit full-screen navigation
Clicking again on the full-screen view button takes you back to the Navigation dashboard.
Navigation considerations for Free Edition
The Navigation Dashboard in Free Edition is a limited version relative to the Standard Edition described above. It consists of a single map and camera view, and does not include the Hi-rez option or full-screen navigation because it is intended only for monitoring the robot, without any interaction.
Here’s how you add a new robot to your InOrbit fleet. The process involves copying and running a command on your robot's command line to install the InOrbit agent.
What you need
- Internet access from your robot
- Shell access on your robot
- The Owner or Administrator role in InOrbit Control
Steps
- Log in to InOrbit Control.
- Select the Fleet dashboard to find and click
 .
. - Select and copy the displayed curl command.
- Log in to your robot's Linux shell.
- At the command line, paste the copied curl command.
- Hit enter to continue through the InOrbit agent installation process. See notes below.
- After the installation is complete, you are returned to the shell command line.
Notes
- You are prompted to enter your username and other other information needed by the installer.
- You are kept informed of the installation progress, including installation of software required by the InOrbit robot agent.
- You might be instructed to enter various commands, such as sudo, as required by the installer.
Results
- The InOrbit agent is now installed on this robot.
- The robot's host name is displayed in the Fleet widget in InOrbit Control.
- InOrbit begins collecting data about your robot for you to examine on InOrbit Control.
Please see Advanced agent configuration for further information on customizing the agent.
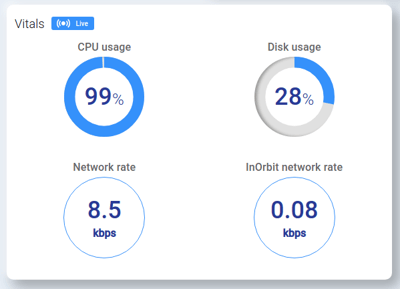
After you've added a robot, you can see its operational status and vital signs directly on InOrbit Control.
What you need
- You need to have added a robot to your fleet.
Steps
- In your browser, go to InOrbit Control at https://control.inorbit.ai.
- If prompted, login with your Google account.
- Select the Robot Dashboard.
- Select the robot you want to check out using the Robot Control widget.
- Look for the Vitals widget, which is one of the default widgets in this dashboard.
Results
InOrbit Control shows you at-a-glance details about your robot's operational status:
Explore other valuable operational details about your robot, including selected data on a timeline, current mode, incident list, and more.
Here’s how you invite a new user to your InOrbit account. This provides the authentication to enable colleagues to have individual access to a shared InOrbit account.
What you need
- An active InOrbit account
- Owner privileges on the account
- Email addresses for any users you want to invite
Steps
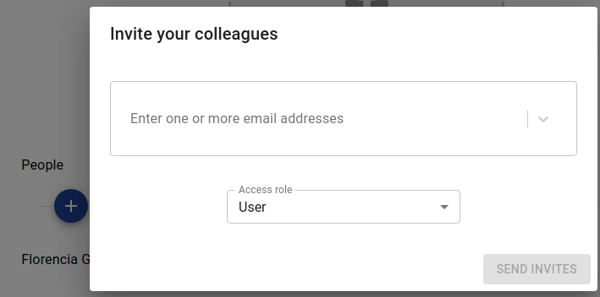
- Log in to InOrbit Control.
- Go to Settings->Admin->Company Details->People.
- Click the circled + sign.
- Enter 1 or more email addresses separated by commas or spaces.
- Select the role (e.g., Owner, Administrator, User) that the new user(s) will be granted.
- Click SEND INVITES.
- User(s) should receive an email to confirm and will be added after confirming.
- After confirming, users can log in to InOrbit Control with the privileges for that role.
Notes
- Roles can be configurable, but Owner is the only default role authorized to invite users.
- Invited users will appear in a Pending state in the People list until they have confirmed.
- While a user is Pending, a login link is available on their entry that can be copied and directly shared with them as a backup.
Results
- The invited users have individual logins to the shared account.
- The invited users start with their assigned role, which can be modified by account Owners.
Locations enable robots to be grouped based on their geographic location (a city or address that can be displayed on a map). Locations can have multiple areas that represent different parts of your site such as different floors.
Locations have tags associated with them, like any other collection, but that tag has an underlying physical location. Adding that tag to any robot will enable grouping by location and easily associating robots with individual or common sites. Alternatively, uploading a robot map to a location from the Locations Dashboard will automatically associate that robot with the corresponding location.
Configure locations for your account
-
Use the Locations Dashboard to create a new location. Give your location a unique name; this can be whatever you need it to be, from a city to something that makes sense within your system, such as Store #1234. Add an address to enable displaying the location on a world map.
-
Now use the Robots tab in Settings > Organization and assign robots to this location. Note: InOrbit also supports automatically assigning robots to locations if the location can be distilled from a data source, which is recommended as a fleet scale.
For example:

Adding areas and maps
Each location will have a default area when you create them. You can add more areas to your location by navigation to the location, then Edit Location > Site > Add Area
Once you have added one or more areas to your location, you can add maps for the areas. There are two ways to add maps:
-
Add robot map
You can directly upload a map from your robot if your robot builds a map. To do this, select your location and area, then Edit location > Add robot map

-
Upload an image
If you cannot upload a map directly from the robot, or if you have a map/blueprint of your site that you want to upload, you can do so from by selecting Edit location > Upload Map. Here, you can upload the map image. You will also need to enter the map origin and resolution. If your map came from a robot, this information will be included in the metadata. The map origin describes the point relative to which the robot pose is reported. If unknown, you can set the origin to 0,0. The resolution describes how many meters an image pixel represents, it must be known to interpret an image as a map.
You can edit an existing map from Edit location > Edit Map.
Displaying multiple robots on a shared map
Robots report their pose relative to their own maps, however, it is often important to see many robots on a single map so that you can program complex behavior like traffic rules for you locations. To view multiple robots on a single map, select Edit location > Align maps. This tool will help you align a robot map to the default map for your area so that multiple robots can be seen on the default map correctly. Adjust the map position and rotation until the maps are visually aligned and save the result.

You can augment InOrbit’s default robot data with your own custom settings to view specific information/robot attributes you want to see on InOrbit Control.
As described in A look at InOrbit Control, when you add a new robot, InOrbit Control displays default data/information for a robot, such as CPU Usage, HDD Usage, and RAM. These are called “Built-in” attributes.
You can configure InOrbit to capture other desired attributes of particular interest to you, such as system or robot metrics, sensor readings, software component details, and application-specific values. You customize your robot data via the Settings menus in InOrbit Control. A custom attribute applies to all robots in your entire fleet. Custom attributes can then be used for real-time monitoring, to visualize values over time directly in InOrbit Control, to track overall fleet status or to trigger notifications on events or when something is not within expected tolerances.
Background: Data Sources
InOrbit supports the following data sources. These data sources are obtained from the Robot Operating System (ROS) installed by the InOrbit agent on each robot. (For more information about ROS itself, see the ROS Wiki.) InOrbit also supports additional non-ROS data sources. For assistance in configuring non-ROS data sources, contact InOrbit via email at support@inorbit.ai.
|
Type of Data |
Description |
|
System metrics |
CPU usage, RAM usage, specific HDD partitions, or network interfaces. |
|
ROS Diagnostics |
If you use ROS and have nodes that publish values in the /diagnostics or /diagnostics_agg topics, InOrbit can be configured to work with this data. |
|
Custom key/value pairs |
If you use ROS and want to view a specific data value from your robot, you can publish a std_msgs/String message with the form key=value to the /inorbit/custom_data/0 topic on the agent; for example, apples=10. |
What You Need
- The InOrbit agent installed on the robot whose data you want to customize
- The Owner or Administrator role in InOrbit Control
Steps for Custom Robot Data
Viewing custom data involves two steps:
- defining a customer robot attribute
- displaying that attribute in InOrbit Control
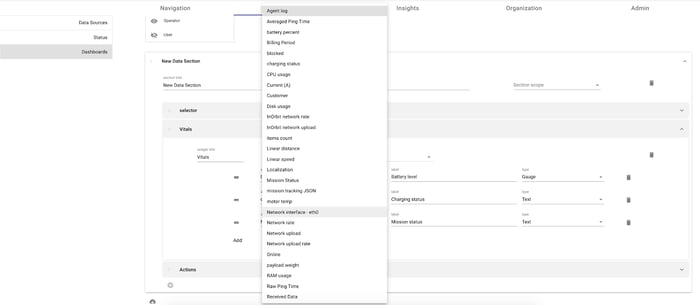
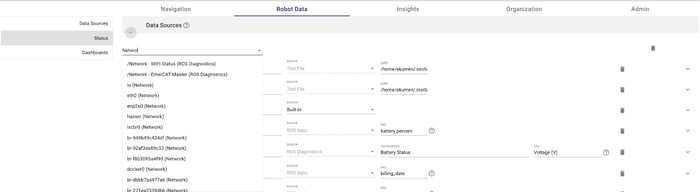
We illustrate this on a specific robot attribute for viewing: usage of the eth0 network interface on your robot.
Part 1: Define the eth0 (example) custom robot attribute
- As Owner or Administrator, login to InOrbit Control.
- From the
menu in the upper right, select Settings.
Result: You are positioned on the Robot Data tab, which is divided into sections: Data Sources, Status, and Dashboards. - To add the new data source, under the Data Sources heading, click the
sign.
Result: A new empty slot for the custom attribute is displayed. - Define the attribute you want to add in either of two ways:
- Select the pulldown menu at the right of the new slot to view predefined system attributes.
- In the empty slot, begin typing the name of the attribute you want to add. InOrbit displays matching data source names that it discovers from your robots such as the different network interfaces, HDD partitions, ROS Diagnostics tools or custom key/value pairs.
- As an example, we want to see the eth0 data source. From the pulldown menu, find and select eth0. The custom attribute is added to the list of Data Sources
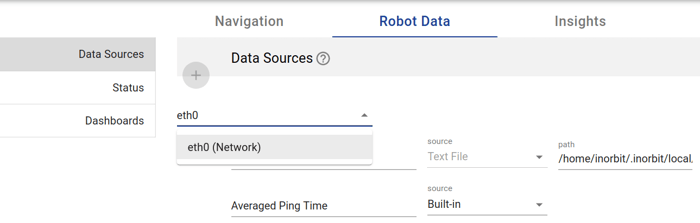
- To add a more user-friendly name for the attribute, scroll to New Data source entry in the Data Sources list and enter the user-friendly name in the first field, e.g., “Network interface - eth0”. The user-friendly name is updated for any configured visualization widget.


Result: You have defined the new custom eth0 attribute, renamed “Network interface - eth0”, and InOrbit automatically saves the new configuration.
Part 2: View the eth0 custom robot attribute on InOrbit Control and change its position
Add a new robot status to Fleet Status widget
You can add a new data source to the Fleet Status widget based on the new custom attribute defined in Data Sources. For this, go to Settings > Robot Data > Status and click on the ![]() icon for the new data source, “Network interface - eth0” in our example.
icon for the new data source, “Network interface - eth0” in our example.
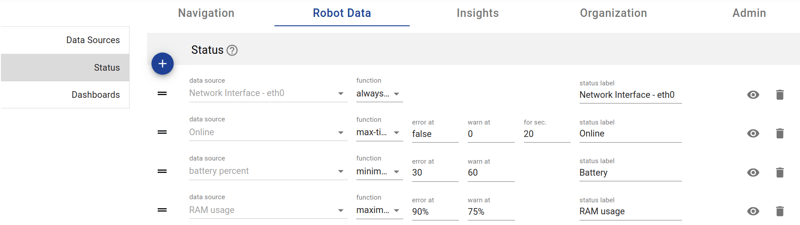
To see the new status, go to InOrbit Control and select the ‘Fleet’ dashboard.
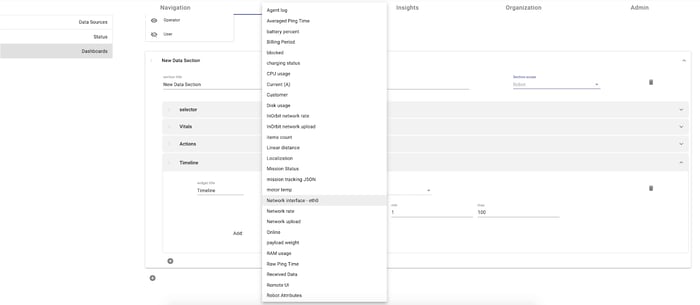
Add a new data source to Vitals or Timeline widgets
To configure the visualization of the new attribute in a Vitals or Timeline widget:
- Go to Settings > Robot Data > Dashboards.
- Select the Dashboard you’d like to add this attribute to.
- Expand the Section where you’d like to add this attribute. You can also create a new section if needed.
- To add the data to an existing widget, expand the Vitals or Timeline configuration and add the new attribute. Note that Vitals widget can only have four data sources. When adding a Timeline widget, the min number of lines must be set to at least 1.
To change the position of the attribute within a widget or Timeline on InOrbit Control:
- Go to Settings > Robot Data > Dashboards
- Select the tab for the Dashboard you’d like to update. Find the attribute in the Widget within the corresponding Section..
- Grab the = handle to the left of the attribute.
- Drag the attribute up or down in the Visualization list to the desired display position.
Result: Return to InOrbit Control to see the attribute in the new position.
When you create your account (see Quick start), InOrbit will start with a default configuration, which tracks only a few attributes from your robots, such as CPU Usage, HDD Usage and Network Rate.
You can configure InOrbit to capture more relevant attributes for your particular operation, such as additional system or robot metrics, sensor readings, software component vitals or application-specific values.
Any attributes you configure can then be used for real-time monitoring, to visualize their values over time, to track overall fleet status and to trigger alerts based on events or when something is not within expected values.
These configurations are managed in the Data Sources section of the settings screen, accessible through Settings:
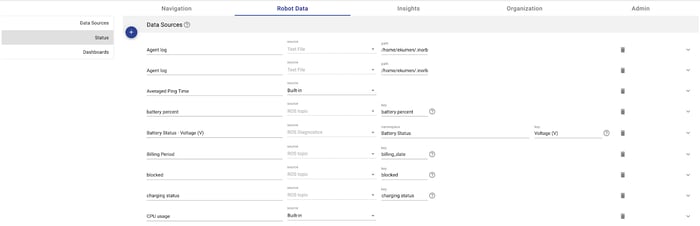
InOrbit currently supports the following data sources:
- System metrics
You can monitor CPU usage, RAM usage, specific HDD partitions and network interfaces. - ROS Diagnostics values
If you use ROS and have nodes that publish values in the /diagnostics or /diagnostics_agg topics, InOrbit can be configured to pick up any of these values. - Custom key/value pairs
If you are using ROS and want to publish an arbitrary value from your robot, you can publish a std_msgs/String message with the form key=value (e.g; apples=10) to the /inorbit/custom_data/0 topic on the agent. - Other types / non-ROS
InOrbit also supports additional and non-ROS data sources, which can be enabled per customer request. Please let us know about your needs by writing to us at support@inorbit.ai.
In order to make it easier to configure, InOrbit lets you search over the data sources that it can discover from your robots. Simply start typing in the box to filter between the different network interfaces, HDD partitions, ROS Diagnostics tools or custom key/value pairs:
NOTE: In order for InOrbit to be able to discover the available data sources on your robot, it is important that the agent be running before you attempt data source configuration.
InOrbit allows configuring custom Actions you can use to send commands to any robot. These actions can be used to quickly and efficiently resolve issues or incidents that occur as part of operating your robot fleet, as well as allowing users to nudge a robot towards the desired behavior.
Overview
InOrbit currently supports five distinct methods of triggering specific robot behaviors and other interactions. These methods can easily be configured with minimal technical knowledge, quickly enabling users to send commands with the click of a button. See also the Robot Lock premium feature.
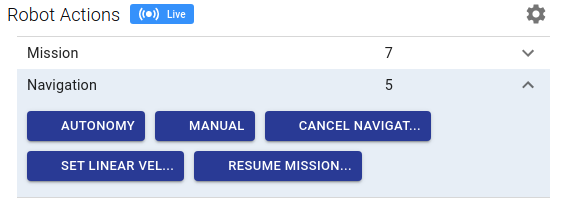
These actions can be made available for execution in the ROBOTS section of InOrbit Control through the Robot Actions widget,
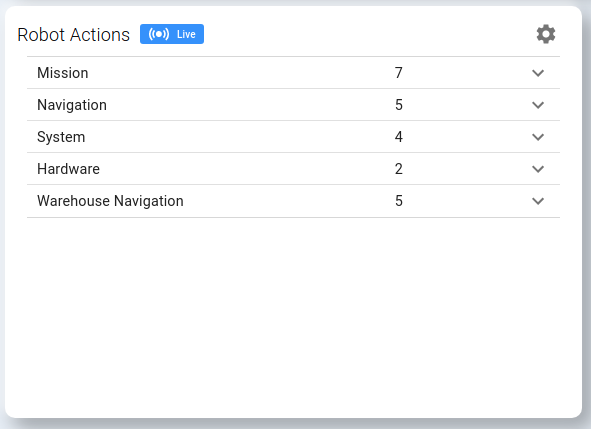
The widget allows you to display actions organized in groups, that you can define in Settings > Insights. Each row shows the group name, the number of actions associated with this group and also a button to expand the section. When this button is clicked, all the actions in the group are shown.
Actions can be also tied to specific incidents for execution through InOrbit Control in-app notifications or Slack.
Integration with other incident management systems such as Opsgenie and custom systems is also available as a premium offering.
Setting up Actions
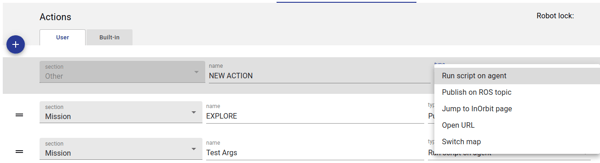
There are many ways to define an action on InOrbit:
- Publish on a ROS topic
Publish a configurable string value through the/inorbit/custom_commands topic on the robot. - Run script on agent
Run a shell script on the robot. Scripts must be placed in the ${HOME}/.inorbit/local/user_scripts directory. - Jump to InOrbit page
Bring the operator to a specified page in InOrbit Control, such as the localization and navigation screen for a robot. Useful to allow you to dive deeper into a problem and perform the most effective resolution action. - Open URL
Take the operator to the configured URL on a Web browser window. Useful to direct your operator to an internal system to continue the resolution protocol for a given incident. - Execute a ROS service (coming soon)
Execute a ROS service on the robot.
To configure actions:
- Go to Settings > Insights > Actions
- Click the (+) icon to add a new action or select an existing action
- For the name field, enter the name for the new action, e.g., NEW ACTION
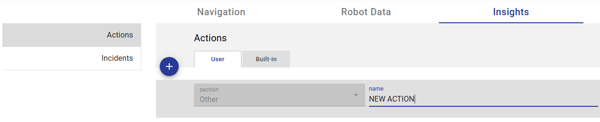
- For the type field, select the desired action, e.g., Run script on agent
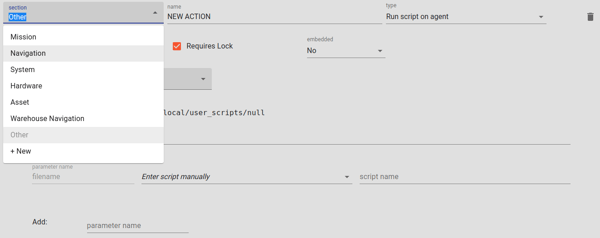
- Each action is listed in a section, which is a grouping of similar actions
- Navigate to the newly created action and select an existing section or create a new section
- Select the Confirm execution checkbox if you want the action to require user confirmation before executing the command. If the premium Robot Lock feature is enabled, you may optionally select Requires Lock to ensure there are no conflicting commands from multiple users.

- Use the embedded dropdown to select which widgets should include this action - note that the selection of the action will cause the section to be included in the action dropdown in the selected widget
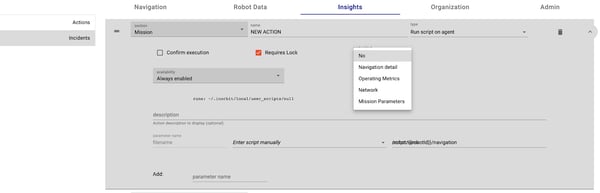
- Select whether the action is Always available, if it should be available Only in collections that are specified by you, or if it should be available only when it's Not in collections that you select
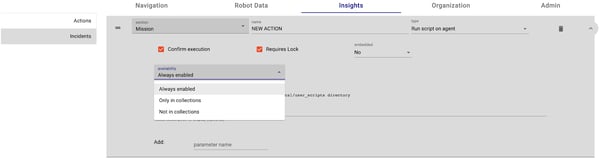
- Each action can be configured with a specific parameter that can be changed or set as needed, including parameters that can be provided by the end user when executing the action
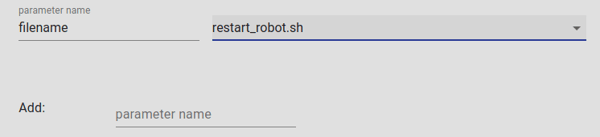
About on-robot shell scripts
On-robot shell scripts you can run after an incident are Linux scripts that you yourself write and are completely under your control.
As an example, you might write a script that lists the top 10 running processes on the robot and saves the list to a file. This could potentially be useful for debugging a robot with high CPU utilization. Such a script could look like the following:# !/usr/bin/bash
# where to save the script output
export SAVEFILE="/tmp/top10cpu.txt"
# list top 10 processes' percentage of CPU, PID, username,
# and running program with arguments, sorted by percentage of CPU,
# and saved to a file
ps -eo pcpu,pid,user,args | sort -k1 -r -n | head -10 \
> $SAVEFILE
- Store the script in ${HOME}/.inorbit/local/user_scripts.
- Make note of the name of the script on the robot because you need to specify the name when you define the action.
Collections
As your fleet grows, InOrbit allows you to organize your robots according to different criteria, such as hardware iteration, customer deployment or location. This allows you to filter or group robots in InOrbit Control based on these different criteria.
Each grouping of robots is called a collection; each robot may be part of one or more collections. All robots are members of the default collection called Fleet.
You can customize the collections and robot membership in each collection by going to Settings > Organization in InOrbit Control.
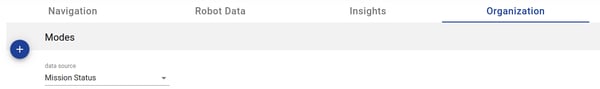
Modes
Modes is a special collection type that can be used to indicate the state or mode in which a robot is operating (e.g. Charging, Idle, or Mission). This value can change dynamically and is assumed to be MECE (Mutually Exclusive and Collectively Exhaustive), i.e. each robot can be in one and only one mode at any given time.
Modes map to a color in the block below the robot name in the Fleet Status widget.
You can group or filter the robots by mode in the Fleet dashboard using the Options control.
Modes are reported in a custom data source. It is up to your application code to report these modes; any modes reported in the data source that do not match the modes defined here will be reported as Other.
Configure modes for your account
- Go to Settings > Organization > Modes.
- Select the data source that will determine the mode a robot is in (e.g., Mission Status):
- Now start adding the different values a mode might take. Click the ‘+’ button and add these one by one
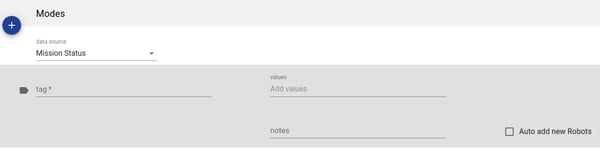
Note: The tag field is the visible name the mode will have, which doesn’t need to match the actual data source’s values for the mode. Tags are unique.
If values are not specified, it is assumed that the tag matches the value that the data source will take. So if, Mission Status can be any of Mission, Idle, Charging, Inventory or Error, the configuration should look like this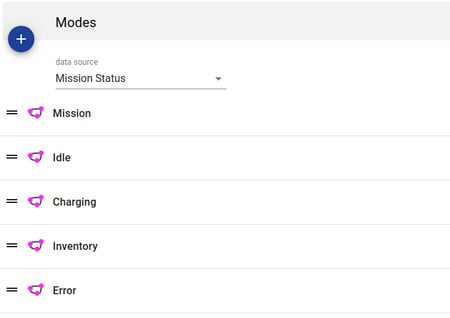
You can also change the order of modes to match the robot behavior; for example, if your robots usually change from Charging to Idle to Mission and back to Charging, you may organize them in that order. Colors are automatically assigned to each mode.
If, for example, the Mission mode is triggered when Mission Status matches any of a set of values (e.g., mission, in_mission, running) or a value different from the tag, you can specify these using the values field: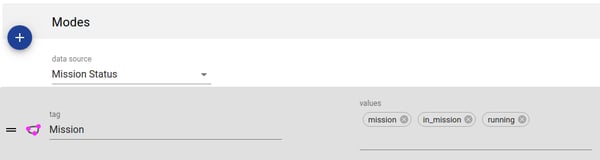
- Done! Now you’ll just need the robot to publish Mission Status=<status> and if the mission status is any of the values defined above, the robot will appear in that mode
- If the status is not on that list, the mode will be “Other”. For example:
Regular collections
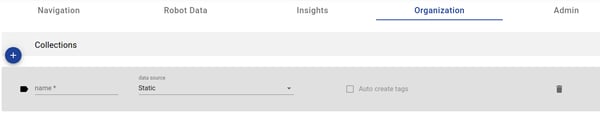
All other collections can be defined in the Collections tab in Settings > Organization. You can add your own collection by clicking the circled + sign. Choose a type such as Customer or Hardware.
Enter a unique name, and optionally add notes and check the box to automatically add new robots to that collection
Depending on the nature of the data source, collections can be either static or dynamic.
Static
Static collections have fixed tags, manually generated, as the members are solely based on tags rather than data sources. Robots need to be explicitly assigned to a static collection by applying a particular tag to it. By default, several collections, including Deployment, Hardware, Customer and Other, are static.
Configure static collections for your account
- Go to Settings > Organization > Collections
- Click on the circled + sign, and a new row will be displayed for you to add a new collection.

- Now you’ll need to create Tags for this collection.
- Go to Settings > Organization > Tags
- Select the tab for the Collection for which you would like to add a tag, and click on the circled + sign. This will present a new row where you can configure the new tab
- Enter the tag name, which should be unique

- Now use the Robots tab in Settings > Organization and assign robots to this tag. For example, If you want to update tags for a robot named ‘Kepler’, you’ll need to click on the dropdown next to the robot name and select the tags it belongs to.
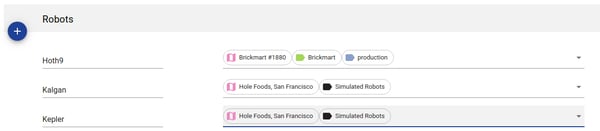
- Then for the rest of the tags you can simply select the existing collection tab and add a new tag for it. Note that if the data source takes a value which doesn’t have a tag defined, a robot going into that state will have the tag “Unassigned”.
Dynamic
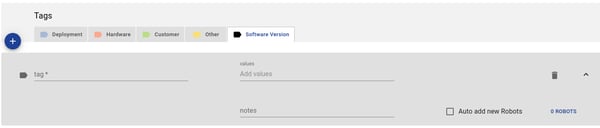
Dynamic collections are collections that are based on known data sources and thus membership can change as values change in the selected underlying data source. These are useful for enabling robots to be filtered or grouped by attributes that reflect the current state of that robot, such as the software version. Modes are an example of a dynamic collection that is built into the InOrbit platform.
Configure dynamic collections for your account
- Go to Settings > Organization > Collections
- Click on the circled + sign, and a new row will be displayed for you to add a new collection
- Give this new collection a name (e.g., Software Version).
- You will see a new field on the right, which is the data source selector. The value of this data source on a robot will determine its associated tag.
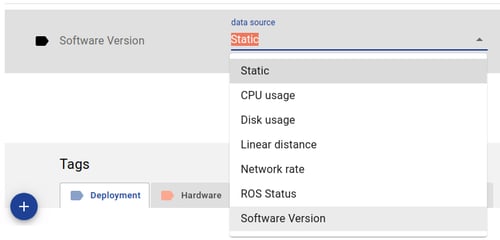
- Now you’ll need to create Tags for this collection. You can either do it:
- Manually as described above for Static Collections.
- Automatically
- Click the Auto create tags checkbox on the Collections config. This will automatically create new tags based on the values that the associated data source takes, which will be reflected in the Tags section.
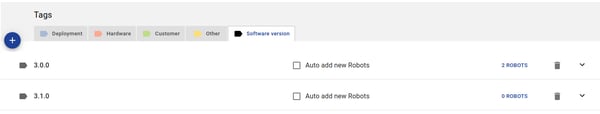
Note: clicking on the robot count for a tag will redirect you to Control, with the fleet status filter set to the specific tag, so only those robots will appear.
You can also delete collections or tags with the trash button. To delete a collection, you must first delete all its tags. To delete a tag, first make sure there are no robots on it.
Group by collections
Once you have a collection, you can group or filter by collections in the Fleet dashboard. For example:
Group by ‘Mode’:
Filter by a particular customer:
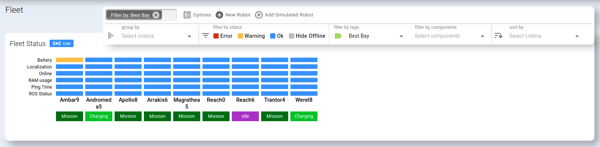
Filter by a component (e.g., battery errors):
As an Owner or Administrator, login to InOrbit Control. Click on the ![]() icon at the upper right and select Settings, where you can set up your robots, data, incidents, actions, dashboards and more.
icon at the upper right and select Settings, where you can set up your robots, data, incidents, actions, dashboards and more.
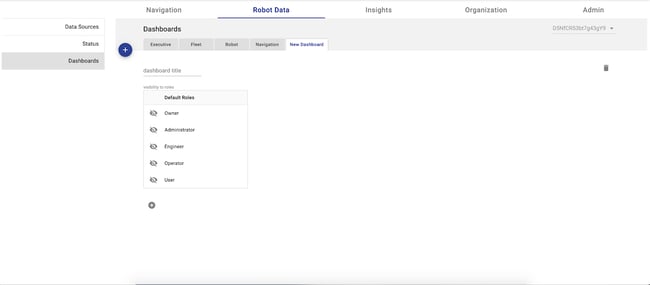
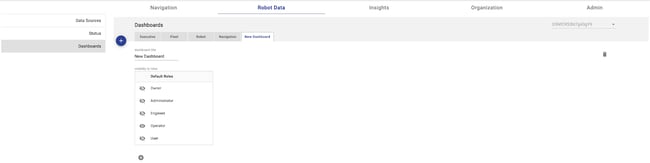
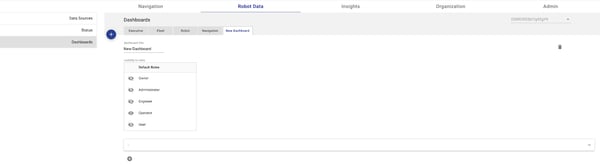
Create a new dashboard
Navigate to the Dashboards section under the Robot Data tab. This area lets you edit and create dashboards.
Click the ![]() button to create a new dashboard.
button to create a new dashboard.
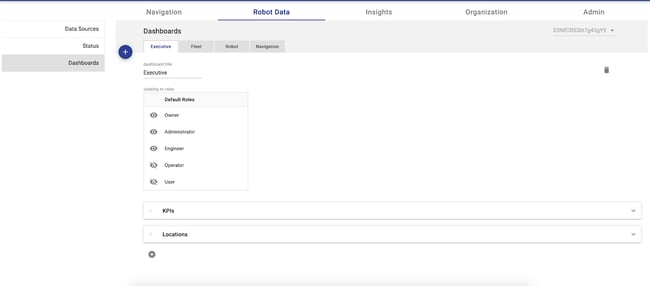
Any dashboard can be renamed by typing the new name into the “dashboard title” field.
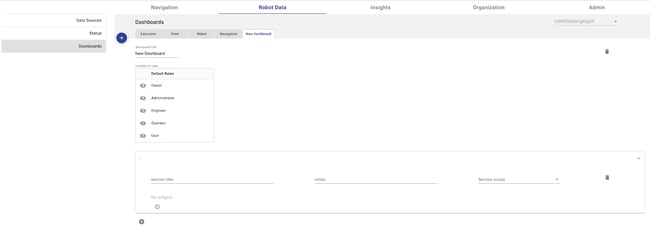
Change visibility of each dashboard
Visibility of dashboards lets a company limit access to specific capabilities of InOrbit Control. Creating specific dashboards intended for different roles or tasks can avoid screen clutter, letting the user focus on their responsibilities. By default, dashboards are hidden from all roles. Make sure to select roles that should have visibility of the new dashboard.
In the example below, the Executive dashboard is set to be visible to Owner, Administrator, Manager, Engineer and Operator roles, but not visible to people with the User role.
In our example New Dashboard, we are going to set visibility to Operator only.
Add a section in a dashboard
Dashboards consist of sections and widgets. Sections are like named folders that can contain a set of widgets.
Click on the![]() button to create a new section in this dashboard.
button to create a new section in this dashboard.
You've just created a new section. Select the![]() arrow on the right to expand the new section for editing. You can rename this section by typing in the “section title” field.
arrow on the right to expand the new section for editing. You can rename this section by typing in the “section title” field.
Set section scope
Sections can contain different widgets based on their scope, Fleet or Robot. We have created two new sections in the image below to demonstrate each scope type.
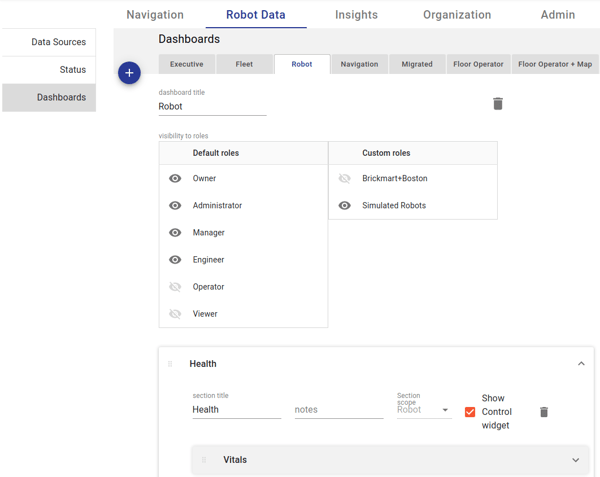
Click the section scope dropdown menu and select Fleet or Robot, depending on what you want to monitor or control in a dashboard section.
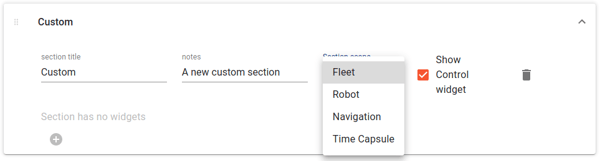
Add widgets in each section
With the section scope set, you can add widgets.
Each section scope type has different widgets available for visualizations. Click on the ![]() button at the bottom of each new section to select widgets for that section (you can add multiple widgets per section).
button at the bottom of each new section to select widgets for that section (you can add multiple widgets per section).
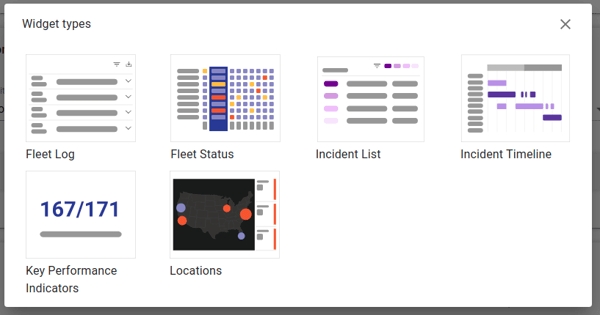
These are the widgets available for fleet scope sections:
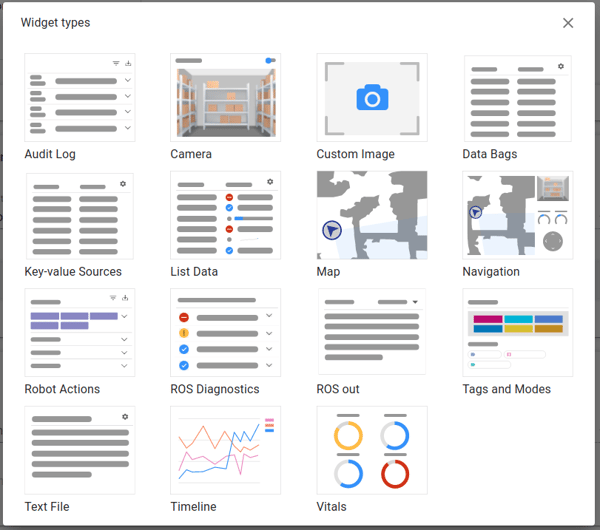
These are the widgets available for robot scope sections:
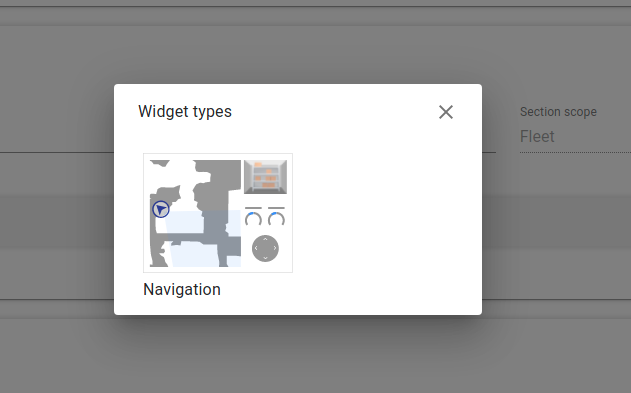
There is currently a single special-purpose widget for navigation sections:
What are the control widgets?
There are 2 control widgets available: Fleet Control and Robot Control. These should definitely be added to any new dashboards where you want to be able to select within the fleet or focus on a particular robot.
Fleet Control lets you filter your robot fleet by a collection (tag) and/or an attribute status. It also allows grouping robots by a collection, or sorting by status or alphabetical order.

Robot Control lets you search for a robot that you have access to and set it as your selected robot to monitor. The widget also has handy shortcuts, such as a button to restart the InOrbit agent, or another that opens the Navigation dashboard.

InOrbit’s agent can subscribe to ROS image topics (with messages of type Image and CompressedImage) and send samples of those images to the cloud. The images are compressed as JPEG, throttled and down-sampled.
This image snapshot based approach is designed to provide the user enough information about the robot’s environment when monitoring or operating it, while minimizing CPU and network usage on the robot. There is a tradeoff between image quality, size and frame rate, as we’ll see in the configuration section.
Video encoding and streaming is available as a separate offering. Please contact support@inorbit.ai for more information.
Configuration
If you go to Settings > Navigation > Cameras, you’ll find a ‘Configuration preset’ dropdown with 3 options:
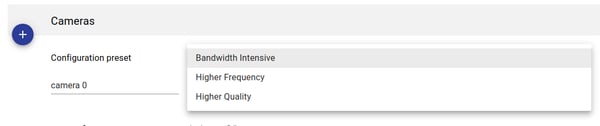
Each preset represent a different configuration for processing and transmitting camera images from the agent to the cloud:
|
Higher Frequency |
Bandwidth Intensive |
Higher Quality |
|
|
Encoding |
mono |
RGB |
RGB |
|
10 |
15 |
30 |
|
|
Size |
380x240 |
380x240 |
720x380 |
|
Frame Rate [Hz] |
2 |
1 |
0.2 |
|
Message size [kB] |
3 |
4.5 |
12 |
These are the combinations we offer in terms of quality / size / frame rate balance, though we'd recommend using 'Higher Frequency' to preserve bandwidth if you don't need a high definition. With the default account set-up, if you make resolution and frequency too high, you may start to experience lag (latency), which is not a desired effect.
Customizing camera views
If you need to focus on the images from a given camera widget, you can enlarge it by clicking within it:
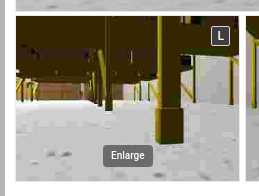
You can further customize the view of a camera widget by clicking on the camera label (‘C’, ‘L’ or ‘R’ in the example below). The label acts like a switch that allows you to alternate between:
- zoom images
- turn off a camera
- full images
Turning cameras off is a useful way to save resources during regular operations, when camera images are not strictly needed.
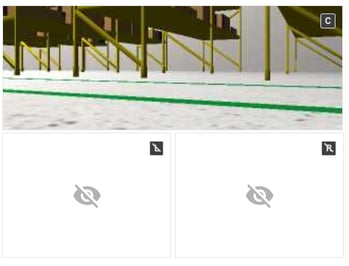
If you need to re-enable a camera for a moment, then you can easily turn it back on by clicking on the label.
Please note that, in order to preserve bandwidth, InOrbit’s agent sends images to the cloud only if a user from a company (at least one) has a Navigation Dashboard open and the camera on.
High-resolution mode
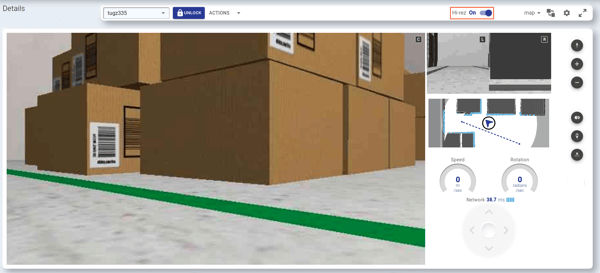
InOrbit offers an advanced option to display the featured camera in an alternative resolution for a limited time (it currently times out after 1 minute), using the Hi-rez switch. This enables you to deeply optimize bandwidth usage by only transmitting full quality images when an active operator needs that quality to discern a detail, such as an aisle or zone number.
The Hi-Rez mode provides high quality images, achieving the goal of being able to see details for a brief period of time. The update frequency is trimmed down to 0.1 Hz to preserve bandwidth. Just click the Hi-rez switch to toggle it on/off.

Advanced settings
Besides the default presets, it is possible to select any arbitrary configuration that you prefer (for both the regular image snapshots and Hi-rez mode). For that, you will need to provide the following parameters to our Customer Success team:
- Encoding (mono or rgb)
- JPEG compression quality
- Image size
- Frame rate [Hz]
After setting up that configuration, cameras will start streaming with the desired resolution and frequency that you choose, along with the preset options in the dropdown menu.
When autonomy fails and other means of resolution fall short, InOrbit Control offers powerful Intervention capabilities that allow you to temporarily take manual control of your robots and teleoperate them back to safety and autonomy.
This ability gives the human operator using InOrbit a greater power over the physical presence of the robot so it must be used with caution.
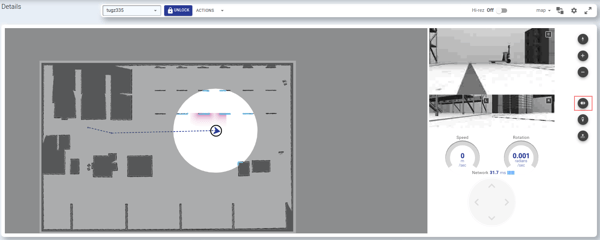
Overview
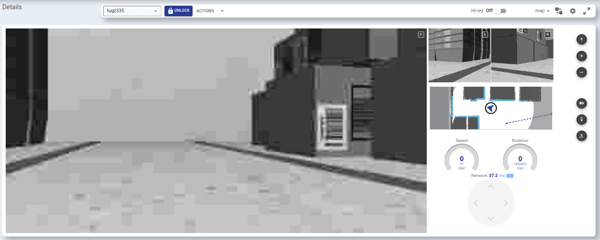
Relocalization and Teleoperation are available when opening the Navigation screen for a particular robot. The controls for both relocalization and teleoperation can be found on the right side of the Navigation dashboard.

InOrbit Control offers flexible layouts to display more detail across maps and cameras.
The “map/camera” button, between the map selector and the settings button, toggles between views that feature the map and the primary selected camera..
Cameras are ordered based on the order of cameras in Settings > Navigation > Camera. You can select the primary camera by clicking on the image within any camera view. Similarly, you can feature the map by clicking on the small map view when a camera is featured. You can turn off a camera (good for reducing bandwidth) by clicking on the label in the upper right of any camera view.
This is an example of featuring the primary camera.
To improve the video quality, InOrbit offers an advanced option to display the featured camera in high resolution for a limited time (it currently times out after 1 minute), using the Hi-rez switch. This enables you to deeply optimize bandwidth usage by only transmitting full quality images when an active operator needs that quality to discern a detail, such as an aisle or zone number.
Updates will be significantly slower while in Hi-Rez mode based on the additional data transmission, but the primary goal is to be able to see details for a brief period of time. Just click the Hi-rez switch to toggle it on/off.
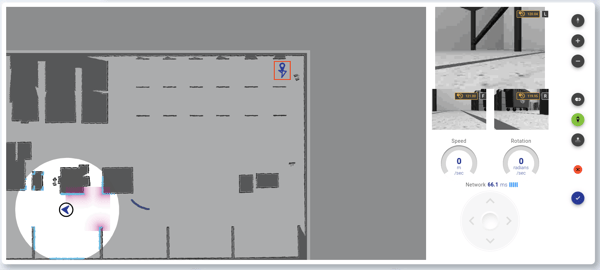
Relocalization
To ensure that the robot is properly localized to accurately track and control the robot navigation, the map displays lidar dots reflecting how the robot is currently recognizing obstacles. If the lidar dots are not properly oriented with features on the map, navigation becomes more unreliable.
Relocalization may be all that is required to restore proper navigation by the robot, or it may be the first step before taking over navigation via teleoperation.
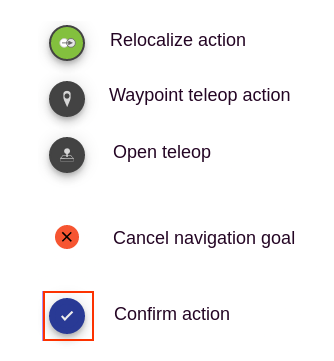
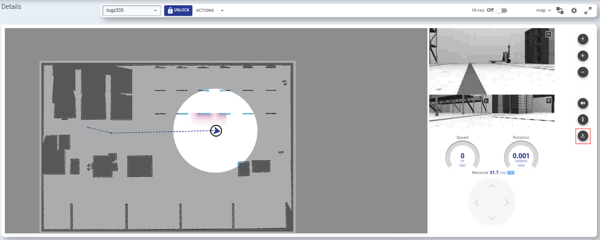
First activate relocalization by clicking the Relocalize button.
It is easy to relocalize a robot with two controls:
- Clicking and dragging the rotation control above the robot avatar enables rotating the map features

- Clicking and dragging on the robot avatar enables translating the map in xy space to align the lidar dots with the features
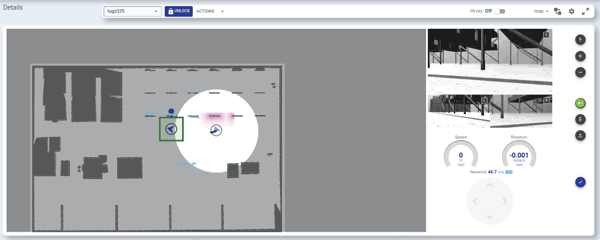
Click on the check mark in the lower right to confirm relocalization. If you decide to cancel or start over, click the Relocalize button again to abort the ongoing action.
Teleoperation
To provide flexible options for different needs/preferences, there are currently two modes available for Teleoperation:
- Open - send a very simple velocity or movement command to the robot to move in a certain way without invoking the robot’s navigation stack
- Waypoint - send a command to the robot to move to a specific target location, using its internal navigation stack
See the Security measures section below for important information about how InOrbit restricts teleoperation to ensure the safest possible operating conditions.
Open Teleop
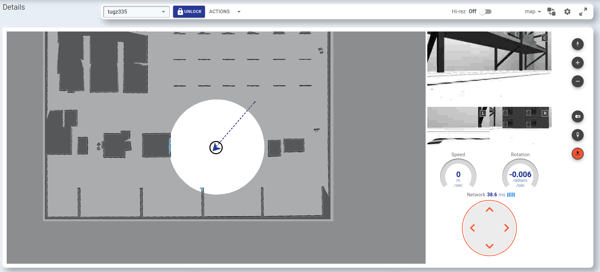
Selecting Open Teleop activates a d-pad with arrow buttons in the lower right corner. Clicking on the up or down arrows send commands to the robot to move a single step forward or backward, relative to the current robot position and orientation, respectively. Clicking on the right and left arrows send commands to the robot to rotate clockwise or counterclockwise by a fixed angle, respectively, again relative to the robot.
Above the arrows are meters to show the linear velocity and angular velocity when the robot is moving, and a network gauge to ensure that the roundtrip latency is sufficiently low to safely carry out the command.
Since this can be a risky mode to be in (as it bypasses the navigation stack that avoids obstacles), the d-pad highlights in orange to make it very clear when the robot is in Open Teleop mode. You can deactivate Open Teleop by toggling off the Open Teleop button.
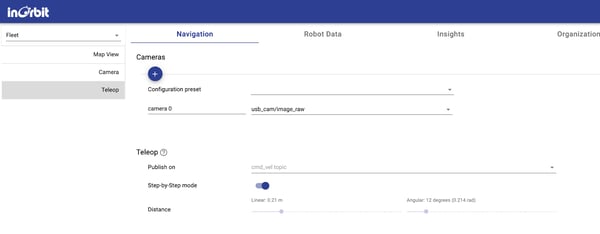
To set a new distance or angle of the increment for each step:
- Starting from the menu of three vertical dots at upper right, select Settings > Navigation > Teleop.
- Optional - Select whether this change should apply to the Fleet or an individual robot with the selector in the upper left.
- Adjust the default Distance or Angle using the sliders.
- Exit Settings and select the Navigation dashboard to resume Teleop.
Waypoint Teleop
Selecting Waypoint Teleop enables selecting a target pose that will send a command to the robot to which it should move. Select the target position by clicking on an arbitrary point on the map or by dragging the pin icon that appears on the current robot avatar to the new target position. Refine the target pose by clicking within the circle indicating the target and dragging to orient the robot avatar to the desired final orientation.
Click the check mark at the bottom to send the command for the robot to move to the waypoint using its navigation stack. Once the robot’s navigation stack computes the path, it will be displayed and the robot will navigate to the target. The gauges on the right display the velocity, network rate and angular velocity.
You can abandon setting a waypoint by toggling off the Open Teleop button.
If you have already triggered a waypoint navigation, InOrbit offers an optional feature to cancel the navigation goal in progress. By clicking on the “Cancel navigation goal” button you’ll be able to forcibly stop the interaction while the robot is moving. Please contact support@inorbit.ai if you would like this activated on your account.

Step-by-step mode
Open Teleop has two options, step-by-step and continuous mode, which respectively only issue a single command at a time or allow holding down a control to send a series of commands.
The default and recommended mode of operation gives you the ability to “nudge” the robot one step forward, one step backwards or rotating a fraction of a spin to the left or right.
This ability is intended to allow you to use discrete, safe movements to move the robot past an obstacle that its autonomous navigation algorithm can’t resolve on its own.
This enables a basic level of human intervention to apply in adverse network conditions to support re-establishing autonomous operations without the need for physical assistance.
Continuous mode (Experimental)
InOrbit includes an experimental feature to allow continuous teleoperation, similar to that found on remote control tools.
In order to enable continuous teleoperation mode:
- As Administrator, login to InOrbit Control.
- Starting from the menu of three vertical dots at upper right, select Settings > Navigation > Teleop.
- Turn the Step-by-Step mode switch off.
After this is done, the following functions become available:
- You can click on a direction arrow repeatedly to achieve a seemingly smooth movement. NOTE: the robot will move an entire foot in the given direction after the last click is pressed.
- You can switch to use a virtual joystick by clicking on an icon that appears in the bottom right of the teleop control.
For Open Teleop, we highly recommend step-by-step mode for safety reasons since the navigation stack is not involved to prevent collisions with obstacles.
For Precision Teleop, the continuous mode only affects the process of specifying the action by, for example, holding down the arrow to change the distance in fixed increments before sending the final command, so it is a convenience rather than a risk.
Security measures
As teleoperation is a dangerous operation, InOrbit includes several safety measures to avoid unintended robot movements:
- Teleoperation is disabled by default, to avoid accidental clicks. In order to start teleoperating a robot, you must press the button for one of the active Teleop modes to expressly enable active teleoperation.
- Teleoperation will be automatically disabled if the network round trip time to the robot is higher than 15 seconds. The currently measured round trip time value is displayed at the top of the teleoperation control.
- Even while performing teleoperation, if the message sent from the user interface is delayed for any reason and the robot receives it more than one second after it was sent, the command will be discarded on the robot side, preventing an unintended delayed movement.
In addition, teleoperation will be blocked unless the following conditions are met:
- Odometry information is being published by the robot and InOrbit can decode it properly
- Robot movement as indicated by robot odometry matches the amount of distance intended by InOrbit’s teleoperation commands
Experimental features
If you are interested in trying out any additional experimental feature or have any input or questions, please contact our support team at support@inorbit.ai.
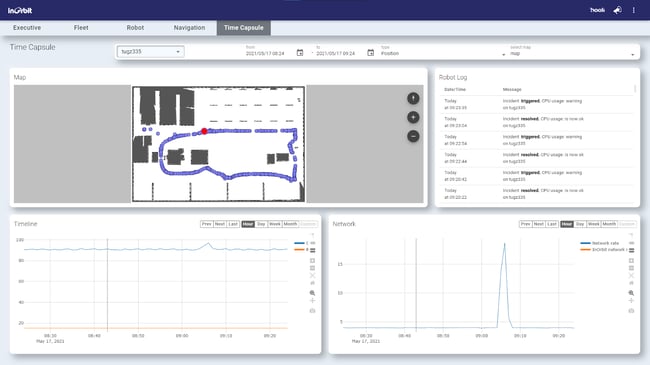
Understanding the environment and behavior of a robot at a given point in time is critical to solving some of the more difficult problems that AMRs face today. InOrbit Time Capsule makes this easier by efficiently capturing, storing, and visualizing the critical information relevant to a robot’s behavior:
- Maps annotated with path, position, and incident detail
- Audit log details relevant to a selected robot and time range
- Timeline charts of system and network performance data
- Mission durations within the selected timeframe
Creating your Time Capsule Dashboard
InOrbit provides a preconfigured dashboard widget for use with Time Capsule. To enable it, follow these steps:
- Select Settings > Robot Data > Dashboards
- Select or create the dashboard to hold your Time Capsule
- Remember to validate Dashboard visibility for the dashboard that will contain your Time Capsule widget, so people in the applicable roles have access
- Create a new Section within the dashboard for the Time Capsule widget
- Time Capsule is available in the Section Scope dropdown menu.
- After selecting the Time Capsule scope for your Section, no additional widgets may be added to this section
- Select the preconfigured layout for your Time Capsule section
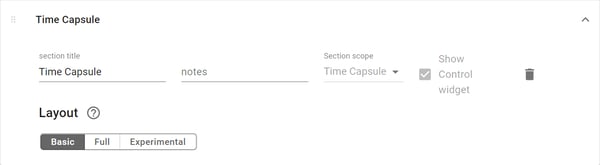
- Basic: Map, Audit Log, System Performance and Network Performance Widgets
- Full: All Basic layout widgets plus the Mode widget
- Experimental: At InOrbit, one of our core values is to Always Be Learning. The Experimental layout is one example of how we apply this value. Currently the Experimental layout includes all Full layout widgets as well as a Key-value Sources widget. In this layout, we will continue to experiment with different combinations of widgets to bring you the most value possible from your InOrbit Time Capsules.
Using the Time Capsule control widget
The Time Capsule control widget contains several options you can choose between to customize your visualization.
- Robot picker: This dropdown inherits the selected robot from your other dashboards while also providing the option to switch between robots without leaving your Time Capsule dashboard.
- Date Range picker: Select the start and end datetimes for your Time Capsule to cover.
- Visualization picker: This dropdown allows you to select the map overlay you want to see for the selected robot and datetime range.

The overlay options are: - Position shows the exact location of the selected robot at different points in time within your defined time range.
- Position (heatmap) highlights with colors the areas on the map where the robot spent the most time within your defined time range. Warmer colors (yellow, orange, red) indicate more time while cooler colors (green, blue) indicate less time.
- Path shows the specific path(s) a robot took during the time range.
- Incidents highlights points on the map where incidents were logged by the robot during the time range.
- Map picker - This dropdown allows you to select the map over which you want to see your data visualized. The options available in this dropdown will be specific to the robot and datetime range you have selected.
Reviewing an incident with Time Capsule
Opening a Time Capsule directly from your incident widget is as easy as a single click. To explore an incident in Time Capsule:
- Expand an incident found in your incident widget
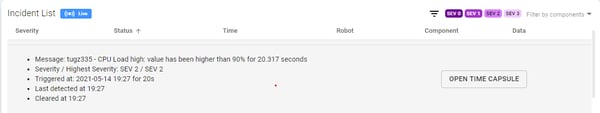
- Click on Open Time Capsule
- You’ll be taken to your Time Capsule dashboard with the appropriate robot selected and a time range starting 5 minutes before the incident and ending 5 minutes after the incident.
Exploring a Time Capsule
Every Time Capsule is an opportunity to explore the environment in which your robot was operating. The data in each of the widgets shown is correlated with other widgets in your Time Capsule dashboard. As you hover over an entry in the Robot Log or the Timeline widgets, you can observe any correlating entries in the other widgets on the screen.
Options for setting the datetime range
When exploring different Time Capsule datetime ranges, you have several options:
- You can set the start and end datetimes as specified above
- Selecting an entry in the Mode widget (found in Full and Experimental layouts) will automatically adjust the time range to the interval associated with that entry
- Selecting or dragging on a timeline widget will automatically adjust to the selected datetime range
Clicking Open Time Capsule from the incident widget will set the time range to 5 minutes before and 5 minutes after the incident.
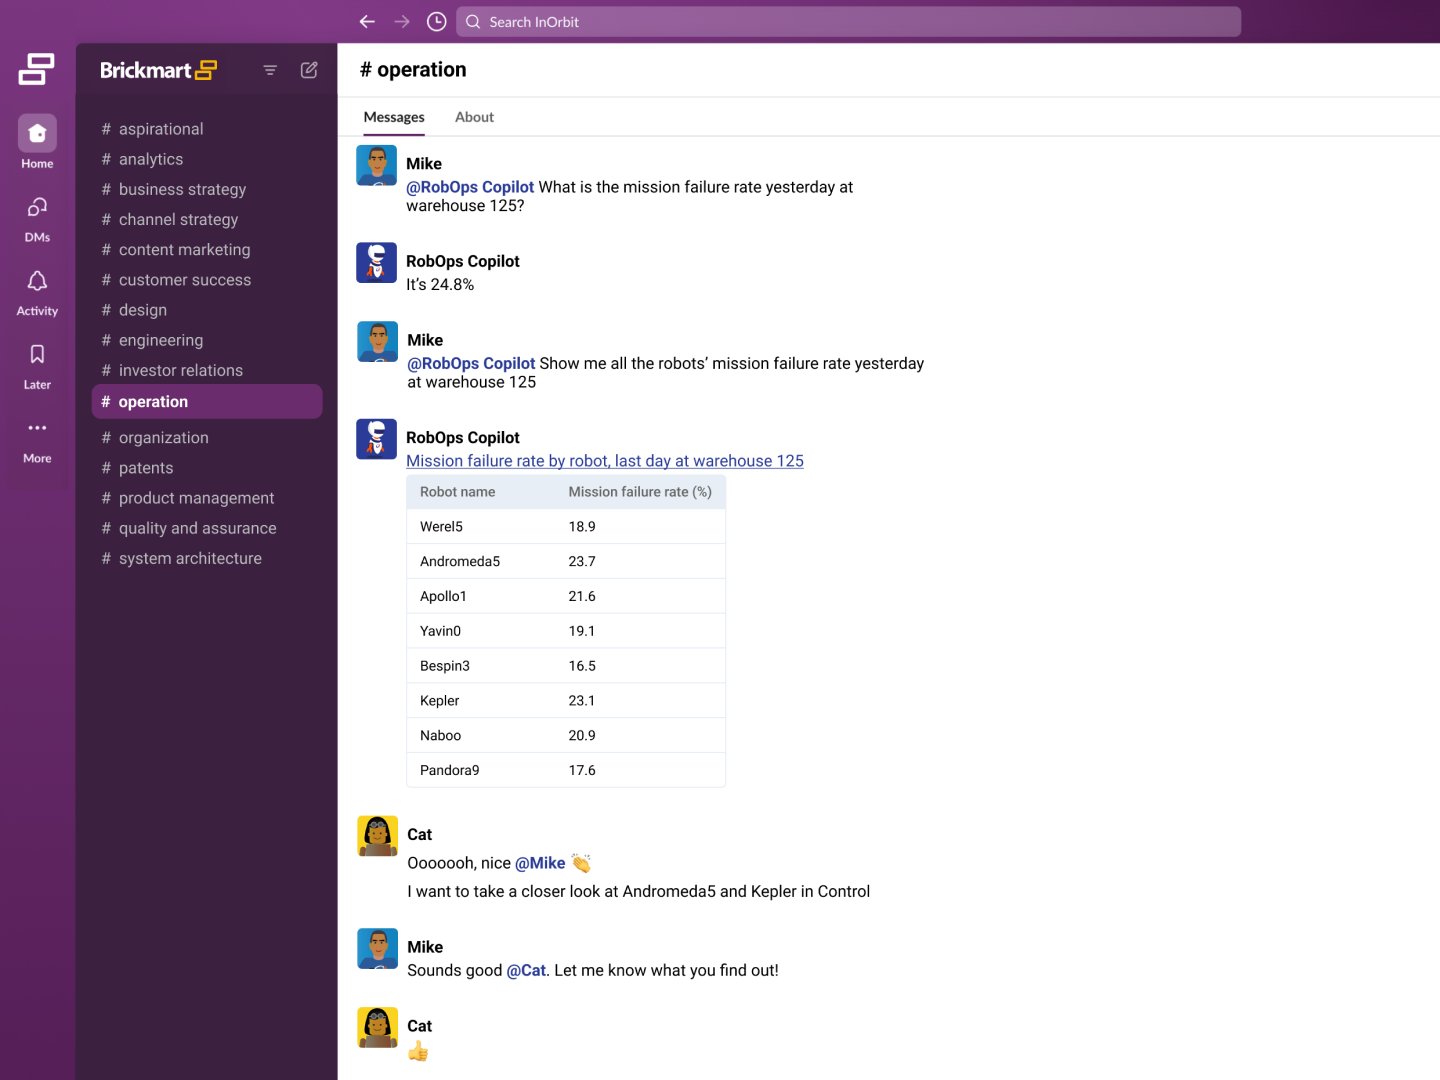
InOrbit RobOps Copilot enhances your interaction with InOrbit by providing a conversational interface to run queries from aggregated robot data to expose details about your robot fleet.
Accessible through the InOrbit Control web interface and popular messaging platforms like Slack, this AI-powered assistant leverages the latest large language models (LLMs), allowing you to ask detailed questions in your preferred natural language using everyday speech and receive detailed answers with the latest data available about various aspects of your robot operations. Conversation can refine analysis further, exploring robot missions, incidents, robot health, audit logs, tags, and telemetry to drive key optimization insights quickly.
Find information here on integrating and using InOrbit RobOps Copilot with InOrbit Control and through supported messaging apps.
Getting Started
Requirements
InOrbit Control web interface: To use InOrbit RobOps Copilot users must have an active InOrbit account with the RobOps Copilot feature activated and have been granted user-based access to RobOps Copilot by their organization.
Messaging interface: While using InOrbit RobOps Copilot in supported messaging apps is not required, it may be useful for team-based data review and collaboration. InOrbit RobOps Copilot currently supports integration with Slack. Additional messaging applications may be supported in future updates of InOrbit RobOps Copilot.
Slack: To use InOrbit RobOps Copilot users must have an active InOrbit account with the RobOps Copilot feature activated, and have been granted user-based access to RobOps Copilot by their organization. To integrate with Slack users must have an active Slack account, and have added Copilot to their organization’s shared workspace.
InOrbit is not affiliated with Slack Technologies LLC, find more information about Slack at https://slack.com/
Features
InOrbit RobOps Copilot allows comprehensive inquiries in natural language on topics such as:
- Missions: Ask about current, pending, and completed missions.
- Incidents: Get details on anomalies or reported incidents.
- Robots: Inquire about specific robots, their status, and operational metrics.
- Audit Logs: Access audit logs to get insights into actions taken to solve incidents.
- Tags: Query and manage tags associated with different robots.
- Telemetry: Perform historical analysis on any robot property.
- Time Capsule: Request snapshots of Time Capsule to view in RobOps Copilot.
Multi-user chat support
While talking to Copilot on messaging apps, you can invite colleagues into the conversation. In this way, all participants can contribute by asking or refining questions collaboratively using the same session context. This collaborative feature is a powerful way to share insights with authorized users on your team.
Seamless Conversation Transition from Messaging to InOrbit Control
Answers in a messaging interface may contain references to specific missions, robots, incidents, or Time Capsules that include links directing you to InOrbit Control. This may allow authorized users to view more details on a topic while the conversation continues with Copilot. The session conversation will automatically transfer and open in the InOrbit RobOps Copilot web interface.
Results Sharing
InOrbit RobOps Copilot often generates insightful answers or reports in response to complex questions. Users on the web interface can create a shareable link to reports generated through conversation. Selecting the ‘share’ icon will create a link that can be opened by anyone using the RobOps Copilot web interface. This allows critical data to be easily saved for future reference, or shared with authorized colleagues.
Query Bookmarks
Once a query has been refined to produce a report or generate the answers you need, you can save the query with a bookmark. Simply select the ‘bookmark’ icon and add a personalized name to your bookmark for easy reference. This allows for a quick recall of previously executed queries when needed again.
Integration with Slack
Once requirements are met users can interact with InOrbit RobOps Copilot via Slack:
- Begin by opening a chat window and typing a direct message to RobOps Copilot to start a conversation By default it will be named @RobOps Copilot. Once open, you can invite other authorized users to the conversation.
- Slack users who are not currently authorized to access InOrbit RobOps Copilot may still be invited to join a Slack conversation with Copilot as an observer only, however, they will not be permitted to pose any questions to Copilot
- Use natural language to query RobOps Copilot for instant results. Alternatively, use the Slack command interface by typing appropriately formatted commands directly in the chat box.
Example commands:- `/copilot status of robot ID`
- `/copilot list all incidents today at location 285`
Integration with InOrbit Control
Once requirements are met, InOrbit RobOps Copilot can be accessed directly through the InOrbit Control web interface:
- Getting started:
After logging into InOrbit Control, click on the floating Orbito icon at the bottom right of the InOrbit Control screen and a chat interface will appear.
- Interacting with InOrbitRobOps Copilot:
Using natural language, type queries into the chat window to explore your robot and fleet data.
Your chat window may be closed or minimized at any time so that you can continue using InOrbit Control normally. If a RobOps Copilot chat window is closed and reopened during the same session, your conversation will resume uninterrupted.
Sample Queries
Checking Mission Details:
- Show details for mission ID 456.
- Show me the list of all missions from robots of model x, from the last 48h at warehouse 125.
- Tell me the average execution time for picking missions over the last week.
- How many missions did robot xyz run last week?
- How many of those failed?
- List the failed ones.
- Tell me the average mission duration of these failed missions.
Checking Robot Status:
- What is the current status of robot 123?
- What was the average battery level of robot x when its missions finished during last week?
Audit Logs
- Did robot xyz have any incidents last week?
- What was the last incident it had?
- List the actions taken to solve this incident.
Incident Reports:
- List all incidents from the last 24 hours.
- Show me all the actions taken to solve incident X
Security and Privacy
RobOps Copilot is built with industry-standard security practices to ensure your data is protected:
- Data Encryption: All data transmitted between your devices, InOrbit Control, and supported messaging apps is encrypted with industry-standard cryptographic algorithms.
- Role/User Based Access Controls: Configure who can interact with InOrbit RobOps Copilot and what information they can access. Learn more.
Reach out to us to learn more about InOrbit security protocols.
InOrbit is committed to continuously improving RobOps Copilot and values your input. Contact our team if you have questions or feedback.
When managing a fleet with various types of robots—such as cleaning robots, inventory scanners, material movers, forklifts, and robotic arms—each type will have unique data that is crucial to its operation. These robots may come from different manufacturers or the same one, but the data requirements will vary by robot type.
For instance, “water level” and “detergent level” are critical for cleaning robots but irrelevant for material movers. Similarly, monitoring battery percentage is essential for Autonomous Mobile Robots (AMRs) but unnecessary for stationary robotic arms..
The concept of “Robot-based Customization” ensures that when a specific robot is selected, the dashboard displays data unique and relevant to that robot. Irrelevant data is dynamically omitted, adapting to the selected robot. This customization maximizes the dashboard’s value by tailoring it to the specific needs of each robot. Depending on the robot type, data within a widget may change, entire widgets may disappear, or entire sections of the dashboard may appear or vanish based on relevance.
"Robot-based Customization” can be implemented through Configuration as Code using Config APIs. This involves applying conditional properties to widgets and sections by specifying appropriate tags.
This powerful feature is essential for managing complex robot operations within a diverse fleet, where different types of robots perform various missions. For more details on using Config APIs, refer to our technical documentation in the Developer Portal.
Customization Examples
Fleet dashboard
The Fleet widget in the Fleet dashboard is essential for obtaining an overview of your robot fleet’s health. By configuring statuses for different robot types through the Config API, you can enable different status sets to appear based on the selected robot. This allows you to seamlessly monitor a diverse fleet with various robot types and data sets through a single pane of glass. Two screenshots below show different types of robots show unique status sets when selected.

The screen above shows a selected robot, with a status set that includes: mission, battery, RAM usage, localization, ping time, and ROS status.

The screen above shows a different selected robot, this time with a status set which includes: robot is stopped, localization, disk usage, RAM usage, fresh water, battery, docking, update failed, laser front, laser back.
Robot dashboard
The Robot dashboard provides in-depth details of the selected robot. Using the Config API, you can dynamically adjust the dashboard based on the selected robot. The following elements can be adjusted:
- Different data within the same widget
- Different widgets within a section
- Different sections within the dashboard
- Widget width (based on a 12-column grid)
- Widget height


The Robot dashboards above show different data within the same widget, different widgets and different sections as a different robot is selected in each image.
Navigation dashboard
The Navigation dashboard offers various actions for a robot, such as teleoperation and relocalization, along with detailed navigation-related information like camera images and speedometers. The availability and relevance of these controls and information depend on the robot type. The Config API ensures that only relevant information is displayed, reducing clutter in the navigation widget and allowing you to focus on what’s important for the specific robot you are monitoring.


The first Navigation dashboard shows teleoperation controls, relocalization options and a D-pad controller, while the 2nd dashboard shows none of these features. This indicates that the selected robot in the second dashboard either does not have those capabilities, or does not allow access to those features.
Time Capsule
The Config API allows extensive customization of Time Capsule, determining what data is shown and correlated. This can significantly enhance root cause analysis capabilities, as the Time Capsule dashboard is tailored to display the unique and specific data details of the selected robot when reviewing historical data.


The first Time Capsule dashboard includes 3 cameras, a map and logs, while the second Time Capsule has 6 small cameras followed by the State Transition widget and Key-value sources. These unique layouts are dynamically loaded on the fly when a different robot is selected for review in Time Capsule.
Settings
When Config APIs are used to dynamically configure dashboards based on robot selection, the Settings screens will appear different. Since Config API-based changes can only be made through code using the InOrbit CLI and not from the UI, these configurations are displayed as a code block when the “Show code” option is clicked.

Settings screens don’t initially show code blocks. The code block appears only when the “Show code” option is clicked.


When a code block is shown, you can switch between YAML and JSON. The code block only shows the portion that has been configured using Config API.
Fleet widget Summary View
When your robot fleet scales to hundreds or thousands of units, visualizing each robot’s health individually becomes impractical. Scrolling through large numbers of robot statuses makes it difficult to see the big picture.
The Fleet widget Summary View addresses this issue. Instead of showing each robot’s health, it displays the number of robots in error, warning, or OK states using a bar graph. This simplified visualization allows you to understand your fleet’s overall health at a glance, without digging into each robot’s status.
Fleet widget “Normal View”

Fleet widget “Summary View”
To drill down, simply click on any section of the bar graph. This filters the fleet to show only the robots in that state.

Clicking on a segment of the graph reveals all the robots in that segment.
To toggle the Summary View, click the switch in the fleet control bar. Clicking it again will revert to the Normal View, which shows each individual robot.

The Fleet Summary View works consistently with “group by” and/or “filter by” options applied.
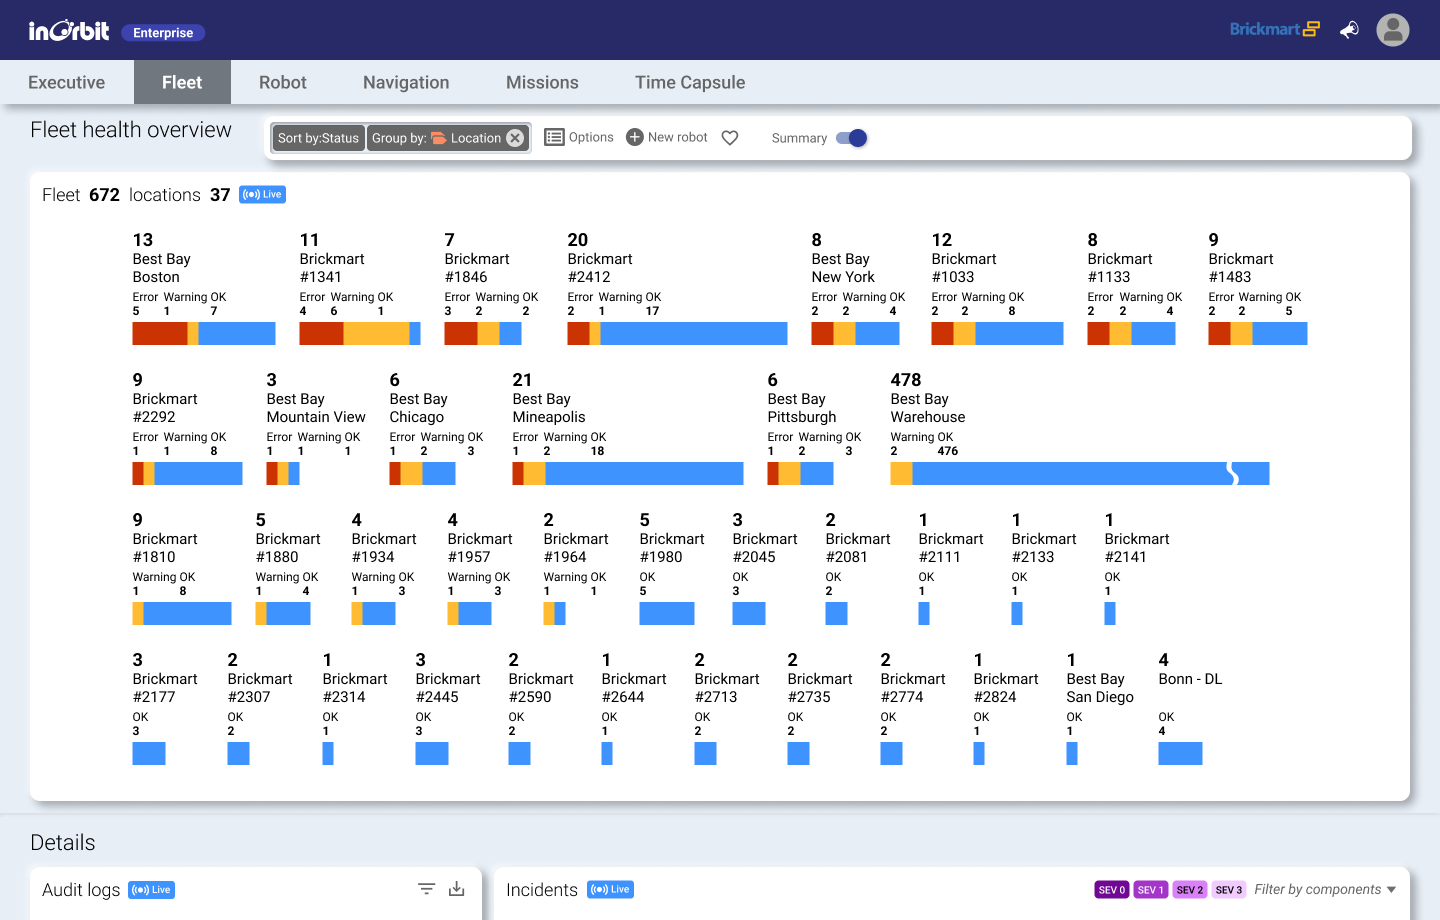
Summary view with ‘group by location’ applied
One of the most powerful features of the Fleet Summary View is that it shows the number of robots and groups, allowing you to see these numbers at a glance without manual counting. The summary view has characteristics that may inform analytic insights. Some users may find it useful for reviewing high-level trends, such as comparing the performance of robots with updated software to those with previous versions
Ultimately, how you decide to use the Normal and Summary Views depends on your needs, fleet size, and preferences. The Normal view is ideal for fleets under 100 robots, while the Summary view is better suited for larger fleets.
InOrbit allows individual robots to be locked while someone is sending specific actions to it to prevent multiple people from executing potentially conflicting actions.
This feature is only available for Enterprise accounts
Configuring Robot Lock
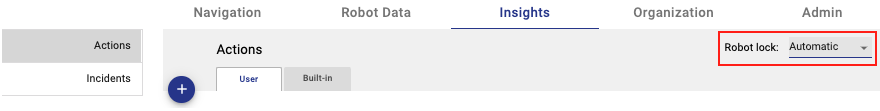
Locks can be configured under Settings > Insights > Actions to be:
- Disabled - locks do not apply (default)
- Selectable - locked explicitly through the
LOCKbutton - Automatic - implicitly locked when a person sends an action that requires lock
Any action can be configured to require a lock on the robot.

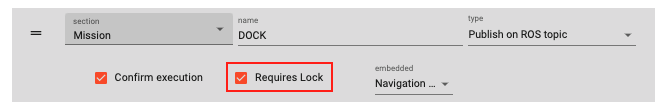
Check the Requires Lock box to specify which actions will implicitly create a lock when used (Automatic mode) or require the robot to be locked before running (Selectable mode).
Using Robot Lock
InOrbit currently supports the following capabilities around robot locks:
Locking a robot

Any robot can be locked by clicking on the LOCK button, which toggles to UNLOCK to easily remove the lock.
Other people can hover over the UNLOCK button to see who currently has the lock on a robot and how long it has been in effect.
Unlocking a robot


The person who locked the robot can unlock it by pressing the UNLOCK button. This allows other people to claim the lock on the robot.
Breaking the lock
If the robot is locked, an authorized person other than the person who locked the robot can force the robot to be unlocked by pressing the UNLOCK button.
In this case, there is a confirmation on unlocking a robot to ensure that this is a deliberate action.
Lock expiring after a timeout
To prevent situations where a person who locked a robot forgets to unlock it, locks are automatically released after a period of time (10 minutes) has passed since the last action on the robot.
Introduction
The results of mission execution are the main determinant of autonomous robots’ usefulness. Data around mission performance also provides a feedback mechanism to pinpoint issues that affect individual robots or fleets and target opportunities to improve performance and reliability.
Missions vary considerably across applications, and could involve picking a specific item, scanning an aisle for inventory, or cleaning an area, as examples. Missions represent the work the robot does, and thus what your company or your customers are counting on when investing in robots.
As a platform, InOrbit offers different configurations to support different customer scenarios, processing mission data from wherever it is available, whether that is on the robots themselves or from the cloud or an edge server.
InOrbit consolidates information from monitoring and controlling missions to help bolster your understanding of your robot’s activity and overall performance (observability/operation) and identifies areas for improvement (optimization).
Missions can be started, cancelled, or otherwise managed via dedicated actions or through the API as in the examples below. The focus of this document is on mission tracking and its ability to provide visibility into the performance of selected sets of missions as well as the progress and data throughout any given mission
Product Offering
Mission Tracking is part of Enterprise Edition and can also be enabled separately as an Add-On. Standard Edition includes the same Mission Tracking capabilities with a lightweight version of Missions reporting.
When missions are enabled in InOrbit, mission information is available throughout the platform. Focusing on the default dashboards in InOrbit Control, missions are visible in several places:
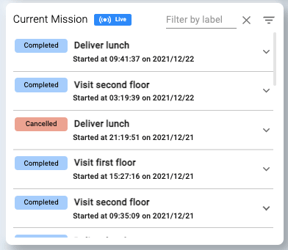
- The Fleet and Robot dashboards have a Missions widget available with listings of current missions and filtering options to explore past missions.
- Time Capsule allows replaying a mission with all of its key data from that time interval.
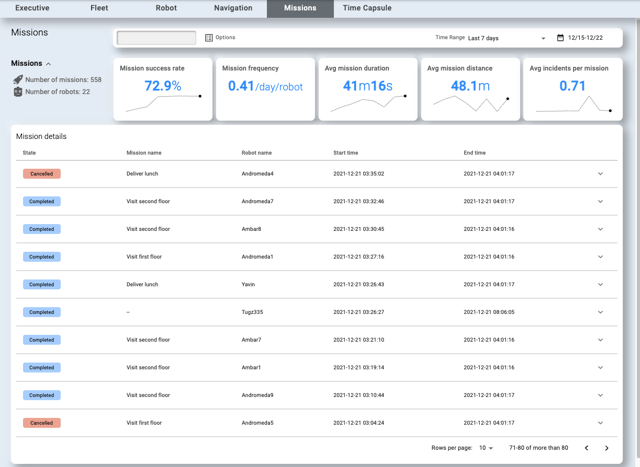
- The Missions dashboard consists of several dedicated widgets
- Mission control - Group, sort, filter missions to select the set to explore
- Mission KPIs - Configurable KPIs for the primary metrics that reflect mission performance
- Mission details - A table showing all selected missions with key data fields, including mission-specific data and the ability to launch Time Capsule
Basic data required to represent a mission
Customers have different ways and terminology for describing and representing missions. They could be quite broad (e.g., perform a multi-hour navigation of a region) or more akin to straightforward tasks (e.g., pick an object). InOrbit has created a flexible model to accommodate a wide range of scenarios, where Missions can fit whatever scale your “mission” is.
InOrbit provides a generalized data model, with mostly optional fields to map to your structures and terminology. There are some critical fields for accurate tracking, and others that can enhance the monitoring feedback, and in some cases it can be derived if your system does not explicitly report it.
For example, missions have scheduled start times (whether they are performed ad hoc or through a scheduler) and actual start and end times to determine whether a robot was on that mission at a particular time. Even the Mission name is optional, but it is easy and recommended to specify a name, which generally makes it easier to do correlations when monitoring multiple missions in real-time or reviewing past missions.
Missions also have a single current state at any given time. This is a freeform (customizable) label, although we offer a pre-defined set of states, such as Scheduled, In-Progress, Late, and Abandoned. Missions also have a current status, which is normally derived from the state, but could also be specified from your system. This is either OK, Warning, or Error. This is similar to overall data status in the InOrbit Platform, enabling consistent presentation and mission-based tracking, alerts, and potentially manual or automated actions for interventions.
Generally all labels and mappings are configurable, and we are happy to help you set up whatever unique structure you require. The platform also includes optional metadata for your specific scenario (e.g., number of picked items, payload, completed scans, signal strength).
Activating your data to be processed as missions
Robot missions can have widely differing scenarios, particularly in how they are triggered and where information is stored. InOrbit can track data directly from robots or integrate with your infrastructure, depending on where the information is made available. In some cases the robot itself determines that it is starting a mission based on some input (e.g., a front panel activated by a local operator). In other cases, there can be a cloud component (e.g., a scheduler or controller) coordinating missions and ordering robots to start them. It is possible that the robot does not know about the scope of the mission, or there isn’t a centralized component that knows about the missions.InOrbit provides a flexible API to accommodate these scenarios. The main entry point for missions is a REST Mission Tracking API, but in many cases it is not necessary to invoke this API directly; this is explained below
Mission data on robots
If mission data is best reported from the robots, the metadata can be published through the InOrbit agent. This involves publishing data sources (like any other data in InOrbit) and configuring them to tie to Mission data. For example, in a ROS environment, it is common to publish some “robot state” as “starting mission” or “going back to dock”; along with other metadata such as “delivery door number” or “route ID to execute”. By configuring these data sources in InOrbit cloud, the API calls are implicit (e.g., you can configure that publishing “robot status=starting mission” implies a call to the start of a mission).
As an advanced scenario that some customers prefer, you can also configure a pre-authenticated channel from the robot to the Missions API by publishing JSON-encoded data which will be mapped directly to API calls. This comes down to how you prefer to manage data on your robots for external communication.
These two scenarios are configured through Mission Tracking Config API, and correspond to “derived” and “api” values processingTypes. Refer to the API specs for details on how to configure each specific mission field and various options for Mission processing.
Mission data from servers or the cloud
If you have your own server- or cloud-based orchestrator or scheduler, you can call the Missions API directly via REST calls.
Missions controlled by human operators
If there is no centralized controller and the robot is directed by individual operators, your system can make direct calls to the API from a remote device, such as a mobile device or laptop, for instance based on a button selection by an operator on that device.
Missions Data Model
The Mission data model consists of “Mission” objects. They have a few basic properties, a number of optional properties, and placeholders for user-provided data. This data can be fed explicitly through APIs (e.g., via JSON objects), or inferred by the mission tracking service, as described below.
Schema
The Mission object structure is captured in the Mission Tracking API document, with details on creating and updating the mission along with the overall schema. Additional calls are available for querying (with filters), terminating, and retrieving information about missions.
The object is broken down as follows:
- missionId: a unique identifier for the mission
- robotId: the robot running (or to run) this mission
- Timestamps:
- startTs, endTs: correspond to the mission start and end time. Any of them can be missing. For example when a mission is created and not running (as scheduled), they are not set.
- scheduledTs: to set a planned execution timestamp.
- updatedTs: a last-update timestamp, set by the system.
- State/Status:
- inProgress: a boolean value for if the mission is currently executing.
- state: a string representing the state of the mission. See below for built-in states.
- status: one of the platform statuses: Ok, Warning or Error. It is used as an overall flag of the mission status. Related to the robot status in terms of values and colors used throughout the platform
- When updating a state, the services can guess the status and inProgress flags of the mission.
- Color codings are available to represent mission status (+state) flags.
- Contents and progress:
- completedPercent: An estimated percentage of completion. This can be set by a user invoking the APIs, as well as inferred by the system. For example if there are 4 tasks and the user sets currentTaskId to the second one, a value 25 is guessed. If the tasks each contain an estimatedDurationSecs, the completion percentage calculation is more accurate.
- estimatedDurationSecs: User-set estimated duration (or: calculated by the system as the sum of tasks’ estimatedDurationSecs).
- currentTaskId: The task currently in execution
- Mission Metadata
- arguments: free-form object with mission parameters, e.g. route id, room id, package ids, etc.
- data: (reserved for collecting mission data during the run)
State and Statuses
The built-in mission states that are supported include:
|
State |
Status (default) |
Description |
|
Scheduled |
OK |
Scheduled but not started |
|
In progress |
OK |
Currently executing |
|
Completed |
OK |
Successfully completed (can also have custom semantics) |
|
Cancelled |
ERR |
Intentionally cancelled |
|
Abandoned |
ERR |
Cancelled due to an error |
|
Lost |
ERR |
Robot lost (mislocalized) |
|
Paused |
WARN |
Paused (not necessarily late yet) |
|
Late |
WARN |
Didn’t start on time or late beyond a threshold |
|
Stale |
WARN |
Latest data exceeds a time threshold since update |
Any number of user-defined states can be used. They can be associated with any status. See Mission Tracking configuration.
In ROS environments, it is also common to use ActionLib and report goal statuses. These can also be mapped to mission states. Contact us at at support@inorbit.ai for more details.
Mission Dashboard
The Missions dashboard is the primary place to explore missions in InOrbit Control. By default, this dashboard consists of 3 sections.
Mission KPIs
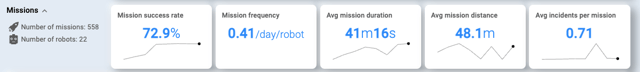
KPIs (Key Performance Indicators) provide a glanceable view of the real-time data that most matters to you about your selected set of missions. Sparklines are included in the display to provide appropriate recent trends for each KPI. InOrbit Control includes the following Mission KPIs by default:
- Mission success rate (%)
- Mission frequency (e.g., per day per robot)
- Average mission duration (hours:minutes:seconds)
- Average mission distance (e.g., meters)
- Average incidents per mission
KPIs also include an aggregate count of the selected set (e.g., missions and robots, as appropriate) included in the overall set, or in individual groups when selecting a grouping category. As mentioned above, this also enables very efficient comparison of sets of missions across the KPIs that are active.
The KPI set is fully extensible to automate any KPIs that our customers value (e.g., specific number of missions of different types, coverage, uptime), as long as InOrbit has access to that data for processing. Please contact us at support@inorbit.ai for any specific KPIs you would like to enable for your application, as we are happy to assist our customers with the process of customizing these.
Mission Control widget

As with the Fleet and Robot dashboards, there is a Mission Control widget for missions. This widget enables selecting sets of missions to focus on throughout the rest of the dashboard, with options for grouping, along with several types of filtering.
Grouping enables simple comparison of the aggregate data for different sets of missions (e.g., Location, Robot Type) for direct comparison. Filters are available for combinations of arbitrary sets of robots, tags, or mission states. There are also selectors for time and date range to easily go back a specific number of hours, days, or months or only include missions for a given date range.
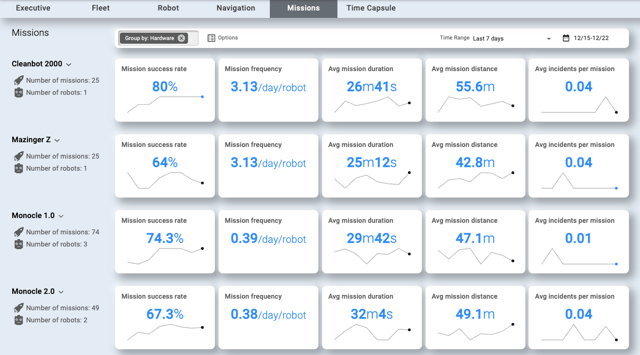
Mission Details table
The Mission Details table provides high level detail on the individual missions that comprise the selected set. The table provides real-time and historic State information along with other basic data around the mission, including the Robot and Start and End time. Every mission can be expanded to see the data values that you select that best represents that mission for your purposes, along with a button to activate Time Capsule for that mission for deeper review of how it went and all of the critical time-series data associated with it.
Examples
While we have been focusing on the interactive selection and presentation of missions, here are some basic examples of using the API to access mission data and inform the mission tracking.
REST API calls
In this first example, we mark the start of a mission, send a mission update and complete it using REST API calls.
First, we call the createMission API for a robot with id ID1234 and some basic data including a mission payload field direction.
curl --location --request POST 'https://api.inorbit.ai/missions' \
--header 'Content-Type: application/json' \
--header 'x-auth-inorbit-app-key: YOUR-APP-KEY \
--data-raw '{
"robotId": "ID1234",
"label": "Aisles 123-456",
"arguments": {
"direction": "North"
}
}'
Note: In this example we used CURL to make explicit every HTTP header and payload that gets sent. We recommend testing the APIs with a similar tool or through a testing tool (e.g. Postman), although a production system will call these APIs programmatically. In the following examples we will omit such details and focus on the JSON payloads only.
The call above creates a mission. The API call receives back a JSON response with the mission data. Note that several fields are derived (in this case a state, several timestamps, and a missionId).
{
"robotId": "gont-noetic",
"label": "Aisles 123-456",
"arguments": {
"direction": "North"
},
"inProgress": false,
"state": "scheduled",
"status": "OK",
"createdTs": 1640173104711,
"updatedTs": 1640173104711,
"scheduledTs": 1640173104711,
"missionId": "37049929-8e15-4419-8a0d-2c14e3b5a90c"
}
.png?width=539&name=Screenshot%20from%202022-08-19%2016-04-27%20(1).png)
This mission was created as “scheduled”, since no explicit state flag was set, and the inProgress flag was not set either. This could be a call from a mission planner or scheduler, pre-creating the mission. Next we will simulate starting it, this time calling the updateMission API (via HTTP PUT), with this payload:
{
"inProgress": true,
"completedPercent": 0.66
}
The API response includes the updated mission object with the new field values (and updated timestamps), omitted here for brevity.
.png?width=535&name=Screenshot%20from%202022-08-19%2016-05-23%20(1).png)
Finally, we end the mission by setting the inProgress flag, and giving it a new state.
{
"inProgress": true,
"state": "completed",
"completedPercent": 1.0
}
.png?width=538&height=248&name=Screenshot%20from%202022-08-19%2016-05-43%20(1).png)
Dynamic Updates using Data Sources
The previous example assumes a scenario where the user can set up a component to communicate about missions to InOrbit. This can be from a mission planner, some ETL, or any cloud component based on the customer infrastructure.
In a different setting, the robots’ agents can be set up to propagate mission updates, knowing that in most cases the robots are aware of their own missions (start, end, status, mission metadata). For this scenario, the Missions Tracking support needs to be configured to connect some data sources to act as mission triggers. They can include:
A data source to act as a mission “delimiter”, with specific values to imply the start of a mission. This is normally related to Modes. For example a key-value data source such as “mode=delivery” can trigger the start of a mission.
Other data sources can be mapped to the mission label, the status and state flags, or any payload in the data field.
In this scenario, the same example as above could be accomplished via the following sequence (assuming a ROS agent publishing to InOrbit’s data sources topic):
- Publish mission=delivery (At this point the mission is already marked as started, with no further data)
- Publish mission-target=Aisles 123-456 (sets the mission label)
- Publish scan-completion=0.66 (sets some progress)
- …
- Publish mission=docking (Ends the mission)
The advantage of this scenario is simplicity of implementation: It only requires that the robot implementation can broadcast mission-related information (for example with a republisher), and takes advantage of the secure, optimized data connection between the InOrbit agent and the cloud.
Advanced Configuration
As explained, there are several ways to configure and use InOrbit Mission Tracking. There are even more variants not covered in this document, including the possibility to time out missions after inactivity, selecting default values for some fields and preventing fields from overwriting each other when multiple concurrent updates happen.
If you are missing any feature around Missions Tracking, chances are that the InOrbit team can configure them for you. Do not hesitate to contact us at at support@inorbit.ai for help.
InOrbit supports 2-way synchronization with Opsgenie, a platform for on-call and alert management used by DevOps teams. Through this premium integration:
- Incidents in InOrbit trigger alerts in Opsgenie
- Resolving incidents in InOrbit resolves the associated alerts in Opsgenie.
- Alerts created in Opsgenie can trigger incidents in InOrbit.
- Closing an alert originated in Opsgenie, resolves the incident in InOrbit.
In all cases, alerts in Opsgenie are enriched with data from InOrbit, including the latest events from the audit log, robot status and collections.
Enabling the integration:
- Create API key in Opsgenie
- In Opsgenie go the the integrations list and add Rest API HTTPS over JSON. Copy the generated API key.
- Configure Opsgenie integration
As administrator, login to InOrbit Control; in the upper right, click Settings in the 3 vertical dots menu, select the Admin tab and on the left menu click on integrations. Turn on Opsgenie and enter the API key from Step - Configure Opsgenie webhook
- In Opsgenie go the the integrations list and add Webhook API
- Configure a custom header “x-opsgenie-webhook-token” using the value shown in InOrbit.
- This value can be obtained from InOrbit in the Opsgenie configuration section, “Opsgenie webhook token”:
- Check “Add Alert Description to Payload” and “Add Alert Details to Payload”
- Enter the Webhook URL obtained from InOrbit in the Opsgenie configuration section, “Opsgenie webhook URL”


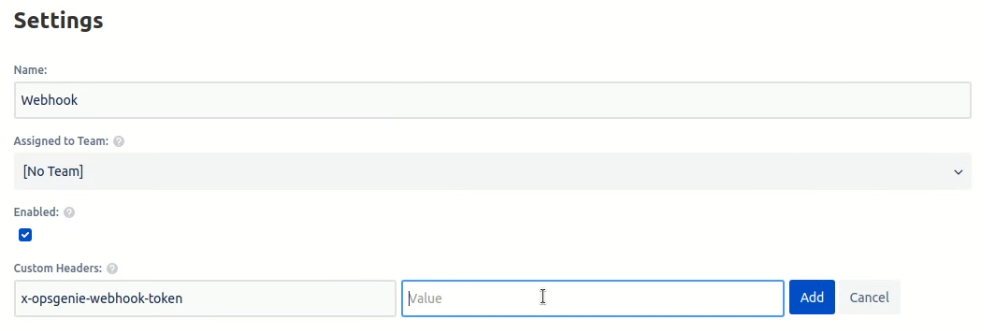
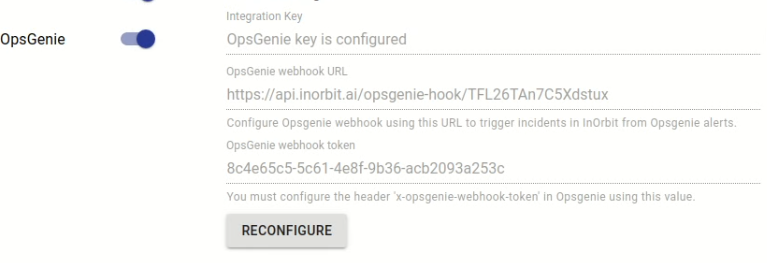
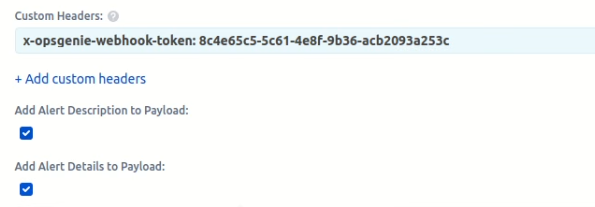

Using Opsgenie as alert channel for an incident
Go to the incidents definitions page at Settings → Insights → Incidents. Edit or create an incident definition and select Opsgenie as the alert channel.
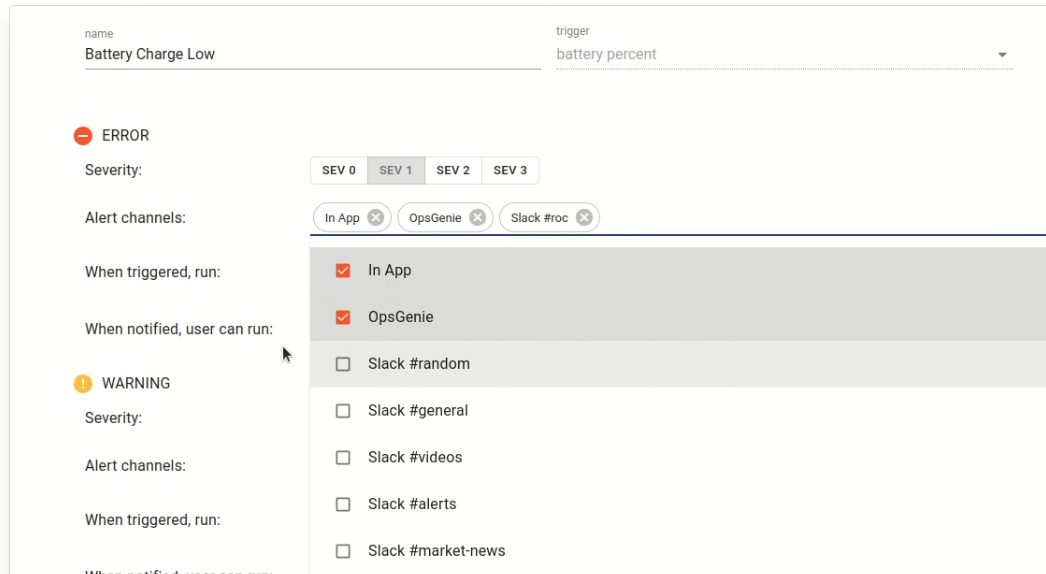
Next time the incident triggers, an alert will be created in Opsgenie.
Triggering an InOrbit incident from an Opsgenie alert
You can create an alert in Opsgenie specifying a robot name or id as the Entity.

This will automatically create an incident in InOrbit
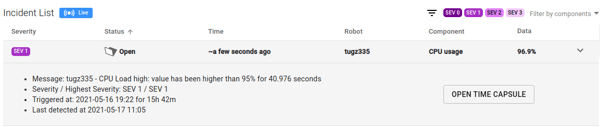
InOrbit supports integration to any incident management platform or internal systems via webhooks and a REST API.
In order to receive events from InOrbit, your incident management system must provide a webhook. InOrbit then sends events to your webhook according to what you have configured, including when an incident is triggered. Webhook events are sent by InOrbit as POST requests to your webhook.
Setting up your Webhook
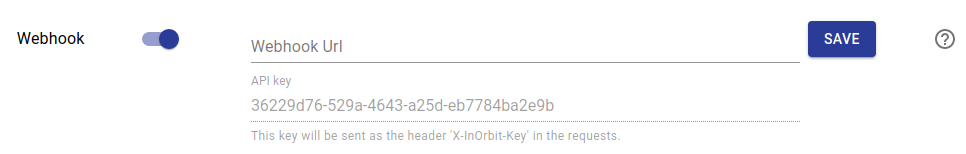
Setting up a callback URL for webhook events requires verification that you control or own the domain that hosts your application.
When you provide the webhook URL in Settings > Admin >Integrations, you will be sent a GET request including the header X-InOrbit-Key (a fixed value, randomly generated), which will contain the API key you see on the screen. Your server should respond with a status code of 200 and the API key that was sent.
Webhook Events
You will receive one webhook event per instance of an incident occurring.
For example, if you configured a Warning to be triggered when the Battery Level goes under 30%, you will receive a POST request when that happens.
{
alertId: <Alert ID>,
entity: {
id: <Entity ID>,
type: <Entity Type>,
name: <Entity Name>,
},
message: <Message of the alert>,
description: <Description, usually more detailed than message>,
actions: <Possible actions that can be executed for the given alert>,
componentId: <Component ID where the alert was triggered>,
status: <Status, could be "new", "resolved">,
ts: <Timestamp when the alert was triggered>,
priority: <Severity of the current alert>
}
Incidents REST API
If you use an external incident management system to receive service requests, you may also trigger a corresponding incident within InOrbit by using the REST API. Incidents created and resolved using the API will be shown in InOrbit.
To enable the API, go to Settings > Admin > Integrations and turn on the toggle.

You can find the API specification at https://api.alpha.inorbit.ai/docs/robots.html. To obtain your API Key, select the green Authorize button.